Geometry Optimization of Thermoelectric Modules: Deviation of Optimum Power Output and Conversion Efficiency


Institute of Physical Chemistry and Electrochemistry, Leibniz University Hannover, Callinstraße 3A, D-30167 Hannover, Germany
*
Authors to whom correspondence should be addressed.
Entropy 2020, 22(11), 1233; https://doi.org/10.3390/e22111233
Submission received: 28 September 2020
/
Revised: 19 October 2020
/
Accepted: 25 October 2020
/
Published: 29 October 2020
(This article belongs to the Special Issue Simulation with Entropy Thermodynamics)
Abstract
:Besides the material research in the field of thermoelectrics, the way from a material to a functional thermoelectric (TE) module comes alongside additional challenges. Thus, comprehension and optimization of the properties and the design of a TE module are important tasks. In this work, different geometry optimization strategies to reach maximum power output or maximum conversion efficiency are applied and the resulting performances of various modules and respective materials are analyzed. A Bi2Te3-based module, a half-Heusler-based module, and an oxide-based module are characterized via FEM simulations. By this, a deviation of optimum power output and optimum conversion efficiency in dependence of the diversity of thermoelectric materials is found. Additionally, for all modules, the respective fluxes of entropy and charge as well as the corresponding fluxes of thermal and electrical energy within the thermolegs are shown. The full understanding and enhancement of the performance of a TE module may be further improved.
1. Introduction
The direct energy conversion from wasted thermal energy into usable electrical energy via thermoelectric (TE) modules has been extensively studied and improved in recent years. Such devices benefit from long-term stability without the need of maintenance and they are quietly operating without moving parts that may get damaged over time [1]. The main parts of research on thermoelectric energy conversion are investigating and improving thermoelectric materials in order to reach high power output and high conversion efficiency on the one hand [2,3] and the scalable and effective manufacturing of devices on the other hand [4,5]. However, up to now, TE modules have not achieved characteristics that justify the investment for a wide commercial usage. Especially, the design of the device, the optimization of the cross-sectional area ratio, and thermal and electrical contact resistivity are crucial factors on the way from a promising material to a functional device with high power output and conversion efficiency [6], even if suitable thermoelectric materials are provided. The aim of the work is to improve the understanding and the optimization of the working principle of TE modules based on finite element method (FEM) simulations of several material combinations with the software ANSYS for various geometry optimization strategies.
1.1. Thermoelectric Materials
The thermoelectric energy conversion can be described by the coupling of the flux density of electric charge jq and the flux density of entropy js. These fluxes are transmitted by the thermoelectric material tensor, which represents the characteristics of the included thermoelectric materials with a cross-sectional area A and length l, when simultaneously placed in a gradient of electrical potential and a gradient of temperature ∇T, as shown in Equation (1) [7,8].
The energy conversion is therefore mainly based on three material parameters: the isothermal electrical conductivity , the Seebeck coefficient and the entropy conductivity at electrical open-circuit OC. In principle, all three quantities are tensors themselves, but, for homogeneous materials, they are often treated as scalars [8,9]. The figure of merit f = zT [10,11] shown in Equation (2), which displays the conversion efficiency of a thermoelectric material, is a function of the three material parameters.
Consequently, thermoelectric materials are usually desired to have a high power factor 2 and a simultaneously low open-circuited entropy conductivity OC. Note that, due to the use of entropy conductivity OC instead of the heat conductivity OC, the absolute temperature T does not occur explicitly within the short form of Equation (2), but implicitly within the three material parameter (T), (T) and OC(T) [11].
Within the thermoelectric materials, the respective flux density of thermal energy jE,th(x) and flux density of electrical energy jE,el(x) at a certain point x across the length of the materials are given as the product of the respective flux density of entropy jS(x) and flux density of electrical charge jq(x) and the temperature T(x) and voltage U(x) = (x) at this point (Equations (3) and (4)) [8]. Note that this description is analyzed as a function of x, along a central line through the respective thermoleg (compare Figure A1), so these values as a function of x are used as scalars.
These descriptions of electrical and thermal phenomena are used as a basis to analyze and improve the understanding of thermoelectric modules within this work. Here, the explicit description of the flux densities of charge and entropy and the resulting flux densities of thermal and electrical energy can be useful in order to further understand and improve the thermoelectric energy conversion.
As thermoelectric materials, various classes of materials have been studied intensively including bismuth telluride [12,13], which is commonly used for thermoelectric modules, other tellurides [14], and selenides [15,16], intermetallic phases, such as as Zintl phases [17,18,19] and half-Heusler phases [20,21], oxides and oxyselenides [22,23], and conductive polymers [24,25]. Each material class provides a different thermoelectric characteristic, requires special treatments or fabrication and it is suitable in a certain application temperature range [2]. In order to influence and improve the thermoelectric properties, band structure modelling via doping and nanostructuring [26,27,28], segmentation of thermoelegs [29,30,31] and the utilization of hybrid materials [32,33,34] are widely investigated.
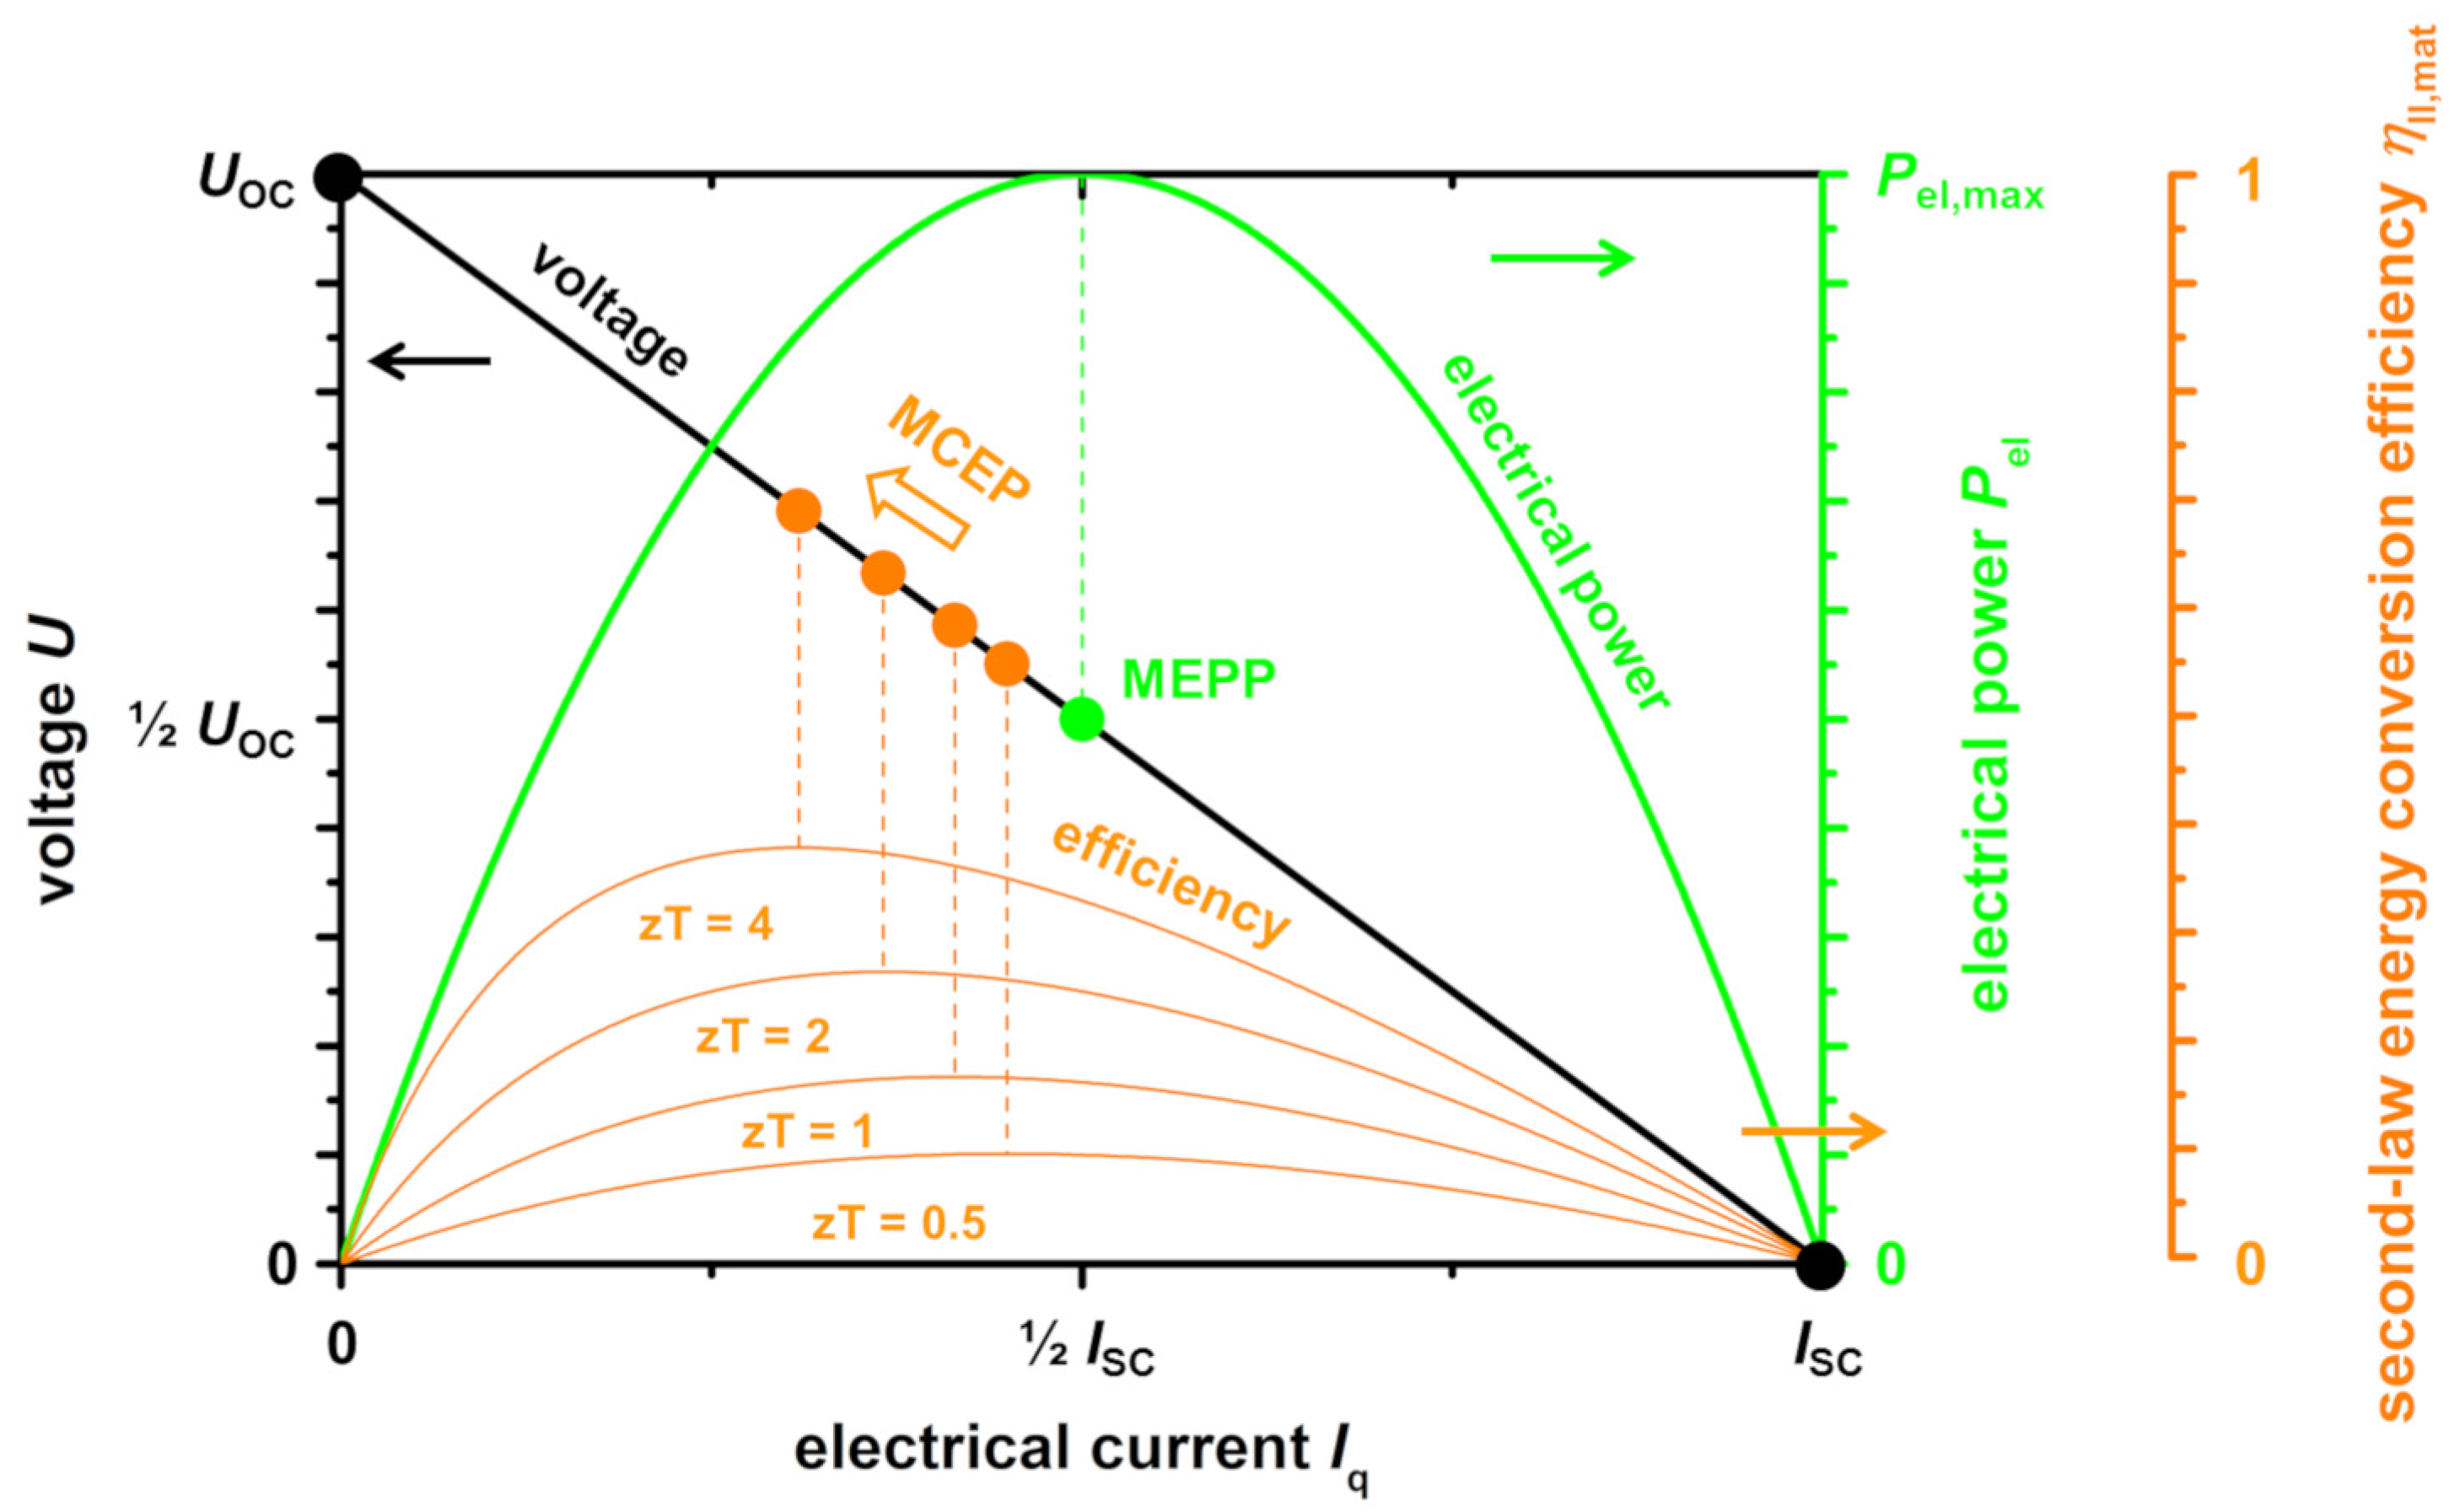
The resulting thermoelectric performance of a material is usually described by the U-Iq-characteristic (voltage-electrical current curve) and the resulting electrical power curve Pel-Iq. Here, two important material working points can be identified: the maximum electrical power point (MEPP) of a respective material (the point where Pel = U ·Iq reaches its maximum), which is given at half the open-circuited voltage UOC, and half the short-circuited current Iq,SC and the maximum conversion efficiency point (MCEP) of a respective material, which is a function of the figure of merit zT of the material. The MCEP and MEPP drift apart with increasing figure of merit zT of the respective material, As shown in a previous work [11] (Figure 1). Therefore, optimizing different parameters to influence the materials MEPP and MCEP are important to effectively improve the performance of a resulting TE module. Furthermore, this implies that not only the resulting conversion efficiency based on the figure of merit zT, but also the resulting electrical power output, which is a function of the power factor 2, is a key parameter. In fact, the power factor should have at least the same significance as the figure of merit zT, as has been reported before [2,35].
1.2. From Material to Device
In this work, the concept of the material working points MEPP and MCEP and the resulting significance of figure of merit zT and power factor 2 are transferred to a TE module. As described before, the concept and design of a TE module also strongly influence the resulting performance. This is based on several factors:
- The respective thermoelectric materials properties.
- The design of the respective device, the flexibility and the free volume.
- The aimed application temperature range, limiting the options for thermoelectric materials.
- Optimization factors, such as thermal- and electrical-contact resistivity, as well as the cross-sectional area ratio between n- and p-type materials
Especially, the respective geometry of the p- and n-type materials strongly influence the certain MEPP and MCEPs of the materials and therefore the resulting performance of the TE module [6]. Often, the geometry is optimized to a maximum figure of merit zT and the resulting An/Ap ratio is used for simulations for example by Ouyang and Li [30]. For certain materials, this optimization, in fact, leads to overlapping MCEP and MEPPs of the respective materials in a resulting module due to matching values of the thermal conductivity n = p [36], which, however, is not always the case. Recently, Xing et al. [36] also described that an optimization of TE modules for a high power output and an according materials choice can strongly enhance the resulting properties when compared to an optimization for maximum energy conversion efficiency. This corresponds to the assertion of the significance of the power factor. Therefore, in this work, an analysis of different material combinations in a TE module is provided, based on the analogous description of jE,th(x) and jE,el(x) shown above for three different optimization strategies: for maximum zT, for matching Iq,SC (and, therefore, overlapping material working points), and for maximum electrical power output. For this purpose, FEM simulations of various modules are provided both based on materials with similar (Bi2Te3-based TE module and half-Heusler-based TE module), as well as with very different thermoelectric properties (oxide-based TE module) of the n- and p-type materials.
2. Methods and Simulation
2.1. Materials and Modules for FEM Simulations
Table 1 shows the used materials. For all thermoelectric materials, literature data have been used. The exact input values are shown in Table A1, Table A2 and Table A3 in Appendix A. As a connector, a metal conductor made of copper with 0.5 mm height, an electrical conductivity of 4.85 × 10⁸ S m−1 and a thermal conductivity of 400 W m−1 K−1 was used. Figure 2 shows the resulting TE modules used for FEM simulations.
2.2. Optimization of Geometry
The An/Ap ratios for the simulated modules have been calculated for three different optimizations: First, according to a zT optimization for maximum energy conversion efficiency that has been derived and used before (Equation (5)) [30]. Here, n and p are the specific electrical resistivity and n and p the heat conductivity of the n- and p-type materials, respectively:
Second, the matching Iq,SC ratio for overlapping material working points was calculated according to Equation (6) (compare Equations (A1)–(A7) in Appendix B). Here, n and p are the Seebeck coefficient of the n-type and p-type materials, respectively:
Third, an optimization for maximum power output was conducted according to Xing et al. [36] via Equation (7) (compare Equations (A8)–(A14) in Appendix C):
Additionally, the areas of the n- and p-type materials have been chosen for the same effective area An + Ap for all modules. The maximum first-law energy conversion efficiency I,TEG,max for all optimized geometries have been calculated from the thermoelectric properties of the materials [9,11,30] (compare Equations (A15)–(A19) in Appendix D). The length of all thermolegs was chosen to be l = 2 mm, as otherwise there would have been too many varying parameters and a fixed and matching length for n- and p-type is reasonable for a functional TE module.
2.3. Simulation Parameters
The software ANSYS Mechanical (Version 2020 R1), which is based on the finite element method, is used in order to simulate the TE modules. Here, a steady-state thermal-electrical conduction analysis that allows for a simultaneous solution of thermal and electrical fields was chosen. After setting the material parameters for the n- and p-type thermolegs, the following boundary conditions for the simulation were set: the temperature of the cold junction, the ambient temperature that is equal to the temperature of the cold junction, the side at zero potential, and the side that determines the value of the electric current; all of the remaining faces were set for free convection in air with the heat transfer coefficient with a typical value of 20 W m−2 K−1 [42].
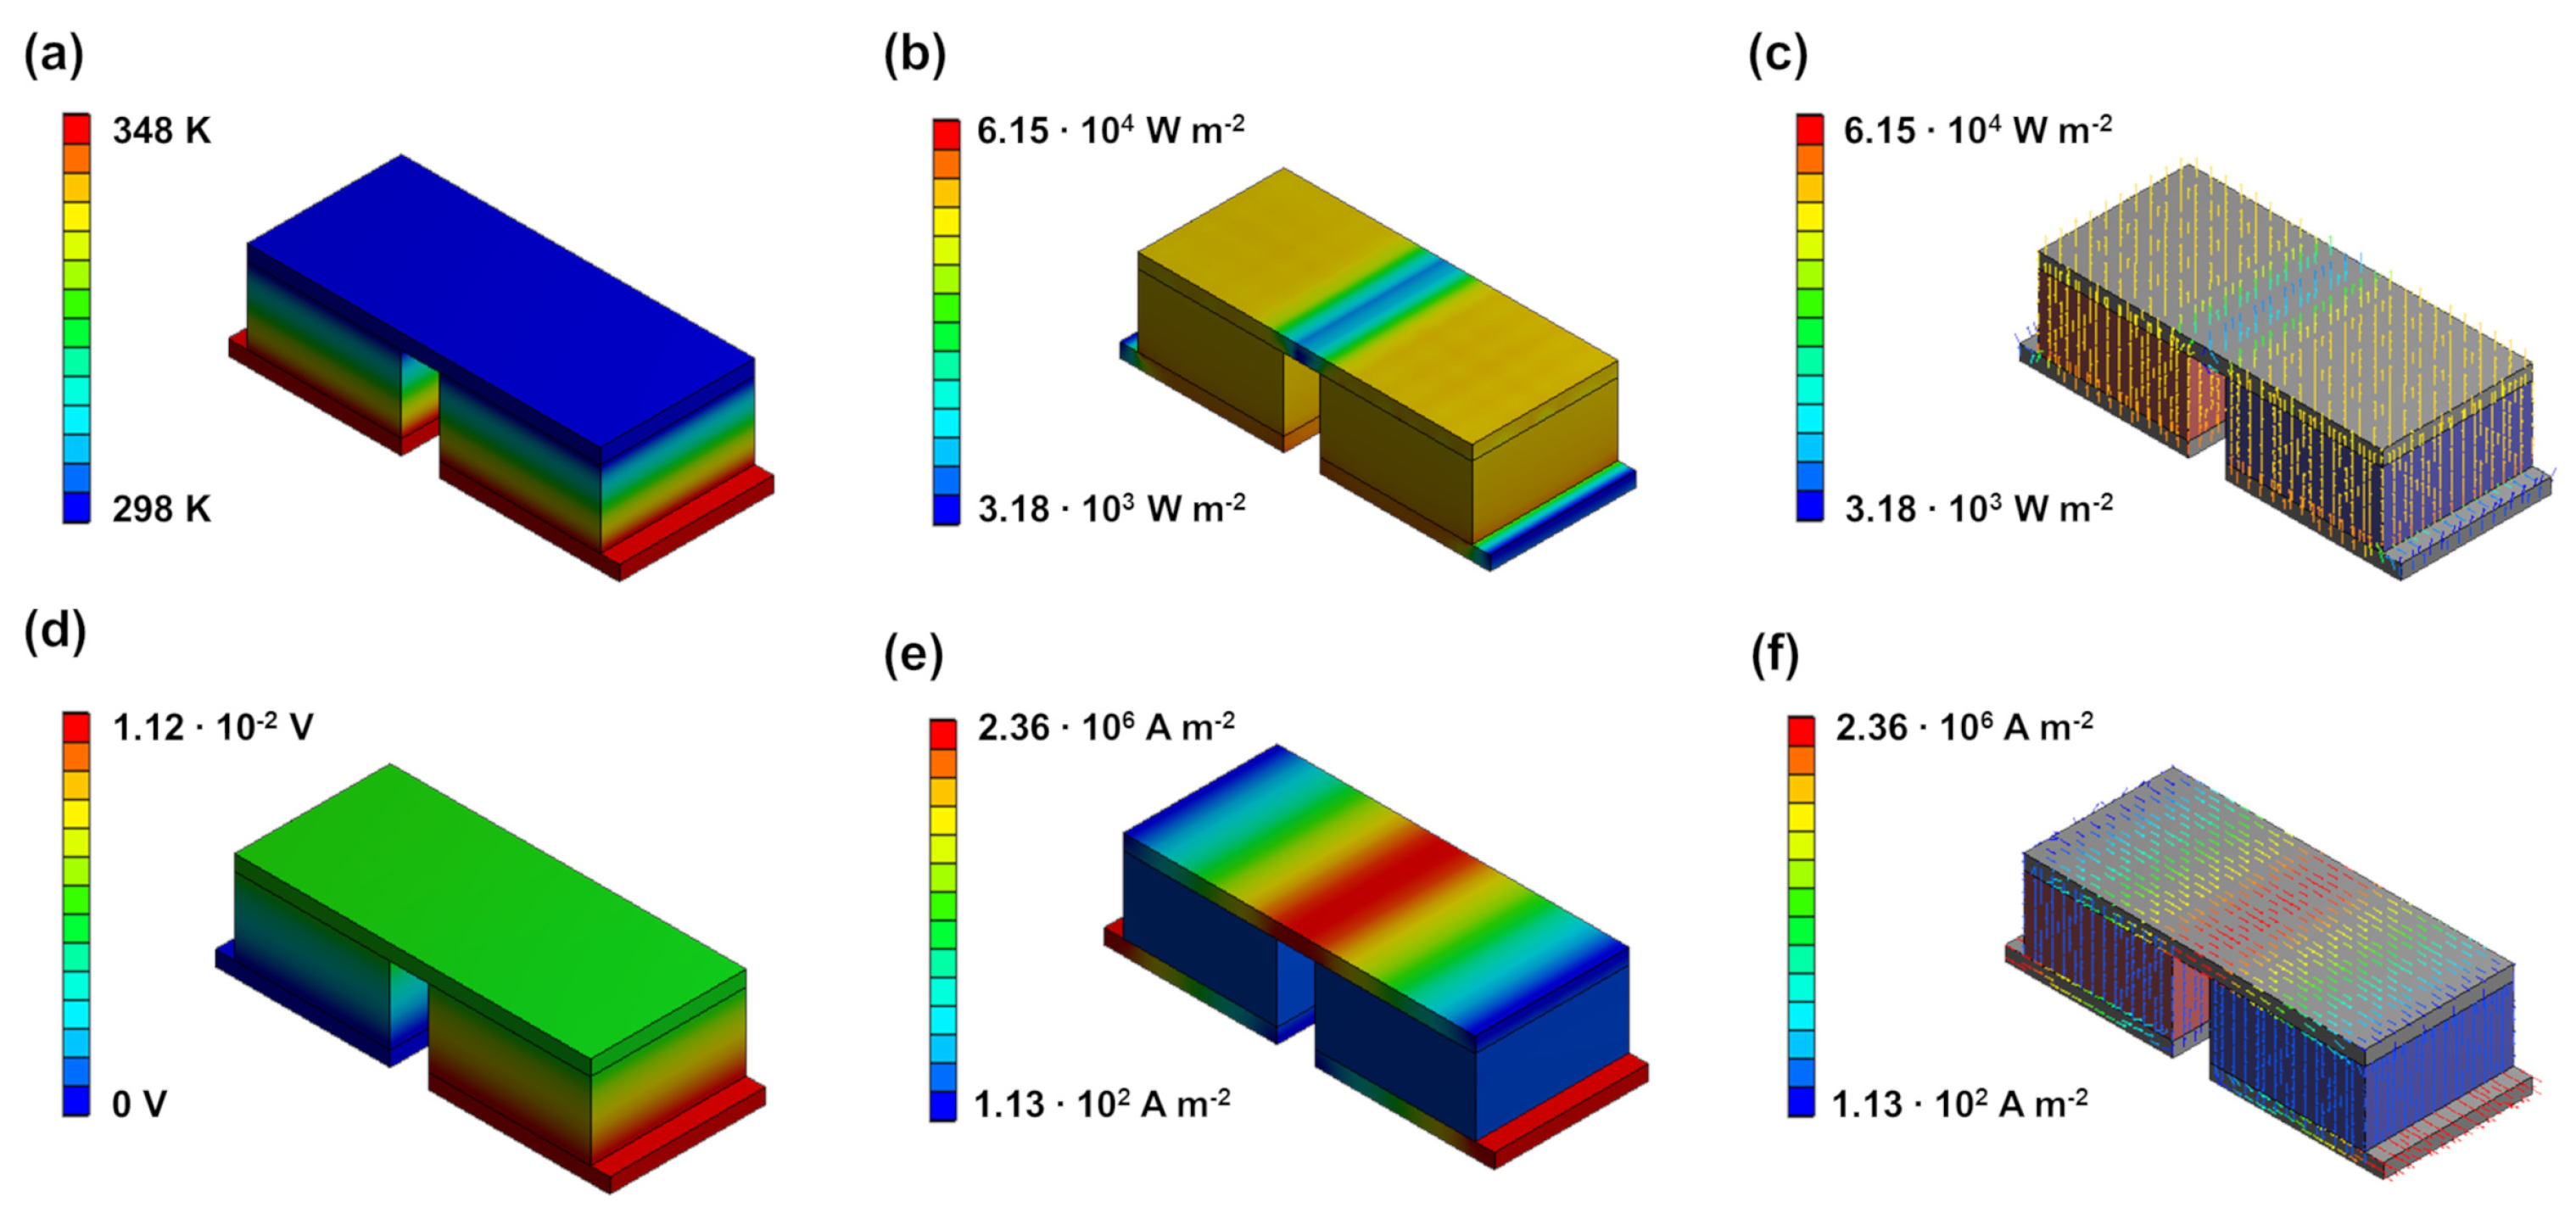
The simulation process was divided into two stages. First, a U-Iq curve was taken in order to evaluate the general characteristics of the TE module. By changing the value of the electrical current that can flow through the TE module, the effect of the external load on the voltage is simulated. Using the U-Iq curve, the electrical power Pel was calculated and a Pel-Iq curve was constructed to determine the MEPP. Then, to study the specific characteristics of the TE module at the MEPP, the following four distributions were simulated: temperature, flux density of thermal energy, electrical voltage, and flux density of charge. From each distribution, the values alongside the center of the thermoleg have been calculated. For these positions inside the leg, the local entropy flux density was calculated from the local temperature and local flux density of thermal energy according to Equation (3). The values of the electrical voltage and the local flux density of electrical charge were used in order to calculate the flux density of the electrical energy according to Equation (4). As a result, a description of all parameters as a function of the position x, along a central line through the respective thermoleg, is received. The corresponding images of the distribution of the temperature T(x), the voltage U(x), flux density of thermal energy jE,th(x), and flux density of electrical charge jq(x) within the thermolegs are shown in Figure A2, Figure A3, Figure A4, Figure A5 and Figure A6 in the Appendix E.
2.4. Notes on Limitations
For all material parameters, a linear behavior within the applied temperature range has been assumed and the average value has been used for the calculation of the An/Ap ratio. Over a relatively small temperature difference of 50 K, the assumption of linear behavior of the thermoelectric parameters can be made, but, for exact simulations, the respective behavior has to be analyzed in detail for each specific case. Because the maximum temperature difference in the simulation was only 50 K and the maximum application temperature was about 1000 K, the dominant mechanism of heat transfer is convection, so the influence of thermal radiation was not considered. Note that, for temperatures above 1000 K and if ceramic substrates are used on top and at the bottom, the thermal radiation becomes increasingly important and has to be considered if an application at higher temperatures is aimed. For all of the simulated modules, an active cooling with a stable temperature difference of 50 K was assumed. Although a matching length l for both thermolegs is reasonable, this may also be optimized, since the length strongly influences the U–Iq-curve as well as the temperature difference, if no active cooling with a stable temperature difference is applied. Additionally, as mentioned before, the electric and thermal contact resistivity between each individual thermoleg and the connector is an important parameter, which has to be investigated and optimized for each individual case. To allow for comparison, ideal contacts are assumed in this work. The results in this work are specifically shown for a thermoelectric module in generator mode, which, however, may also apply for the entropy pump mode in thermoelectric coolers. For the thermoelectric materials, the respective material working points are also correlated to the material properties [11], but, for the thermoelectric modules in entropy pump mode, this is yet to be proven.
3. Results and Discussion
As material combinations, a Bi2Te3-based TE module (module 1), a half-Heusler-based TE module (module 2) and an oxide-based TE module (module 3) were chosen. The respective optimized geometries An/Ap for maximum zT, matching Iq,SC and for maximum electrical power are shown in Table 2. For module 1 and 2, all of the optimizations led to very similar An/Ap ratios. Therefore, only the zT-optimized modules have been simulated. For module 3, the resulting An/Ap ratios vary widely, so simulations of this module were done for all the calculated optimized geometries.
3.1. Similar Material Properties
For the materials that were chosen for module 1 and 2, the optimizations of the An/Ap ratios for maximum zT, matching material working points and for maximum power output all result in ratios near 1, with only a slight variation. This is a result of the fairly similar thermoelectric properties of the respective n- and p-types. Therefore, a fixed An/Ap ratio of 1.04 and 1.08 are used for the simulations of module 1 and module 2, respectively. Note that, although the calculated optimum An/Ap ratios for module 1 and 2 all are close together, they are not the same, meaning that an optimization for maximum power output may still result in a slightly higher power output of the respective module compared to a zT optimization. However, the effect is much stronger for the oxide-based module 3, which is the reason why this module is analyzed in depth for all three optimized geometries.
3.1.1. Bi2Te3-Based TE Module
For module 1, Bi2Te3-xSbx [38] and Bi0.5Sb1.5Te3 [37] were chosen as n- and p-type materials, respectively. As An/Ap ratio, the zT-optimized ratio of 1.04 was used in the simulation. Figure 3 shows the simulated U-Iq characteristics and the electrical power output of the Bi2Te3-based TE module and the respective thermoelectric parameters across the length of the respective legs. The working points of the p- and n-type material with a zT-optimized An/Ap ratio show a good overlap. This results in a high electrical power output of the TE module with a maximum power density el,max,TEG of approximately 124.5 mW cm−2 at the applied temperature difference of 50 K. The individual fluxes that are within in the p-type and n-type thermolegs are shown in Figure 3c–h. The temperature is set to be 348 K at the hot side and 298 K at the cold side. The entropy flux density jS(x) and therefore also the thermal energy flux density jE,th(x) are very similar in the respective legs, due to the similar thermal conductivity of the chosen materials. At the applied temperature difference of 50 K, a voltage U(x) of 11 mV is achieved in one thermocouple. Analogous to the entropy flux density, the electrical flux density jq(x) is also similar in the p-type and n-type thermolegs. In one thermocouple, this results in an electrical energy flux density jE,el(x) of 2.4 × 10⁻³ W m−2. Note that the dashed lines presented in Figure 3c–h represent the metallic connector between the p-type and n-type materials, so both materials are not in direct contact. Thus the different fluxes do not necessarily have the same value at the dashed line.
3.1.2. Half-Heusler-Based TE Module
Figure 4 shows the simulated U-Iq characteristics and the electrical power output of the half-Heusler-based TE module and the respective thermoelectric parameters across the length of the respective legs. For n- and p-type materials, Hf0.6Zr0.4NiSn0.995Sb0.005 [40] and FeNb0.88Hf0.12Sb [39] were chosen.
Analogous to the Bi2Te3-based module, the materials exhibit similar thermoelectric properties and the resulting An/Ap ratio is still near 1. For the simulations, the zT-optimized An/Ap ratio of 1.08 was used. The material working points also show a good overlap as a result of the zT optimization. Therefore, the module’s MEPP and MCEP are also close together. The TE module reaches a high electrical power output of approximately 51.1 mW. With an effective area of 0.334 cm2, this corresponds to a similarly high maximum power density el,max,TEG of 153.14 mW cm−2, which is slightly higher compared to the Bi2Te3-based module 1. The individual fluxes within in the p-type and n-type thermolegs are shown in Figure 4c–h. The temperature is set to be 1000 K at the hot side and 950 K at the cold side. At the applied 50 K temperature difference, a voltage U(x) of 10.54 mV can be reached, which is slightly lower compared to the Bi2Te3-based module, as a result of the slightly lower Seebeck coefficient of the n-type material. The entropy flux density jS(x) of the p-type is slightly higher when compared to the n-type thermoleg, due to the higher thermal conductivity of the p-type material. Analogously, the electrical flux density jq(x) is also slightly higher in the p-type material, due to the higher electrical conductivity of the p-type material. In one thermocouple, a thermal energy flux density jE,th(x) of 16 × 103 W m−2 and an electrical energy flux density jE,el(x) of 2.9 × 10³ W m−2 are reached, both being higher when compared to the Bi2Te3-based module, due to the higher values of electrical and thermal conductivity of the respective materials.
Table 3 summarizes the simulated characteristics of the Bi2Te3-based and half-Heusler-based TE modules. The respective material working points are close together, which results in a high electrical power output and conversion efficiency of both modules. However, the Bi2Te3-based module 1 reaches a higher conversion efficiency of 2.5%, while the half-Heusler based module 2 reaches a higher power output of up to 153 mW cm−2. This is the expected behavior, due to the higher power factor, but simultaneously higher thermal conductivity of the half-Heusler materials. This also displays the aforementioned importance of the power factor (for power output), which, for certain applications, may be equally important as the figure of merit zT (for efficiency).
3.2. Dissimilar Material Properties
For n- and p-type materials of module 3, In1.995Sn0.05O3 and Ca3Co4O9 [41] were chosen. For these materials, the optimizations of the An/Ap ratios for maximum zT, matching Iq,SC and for maximum power output result in dissimilar ratios of 0.06, 0.13, and 0.24, respectively. Therefore, modules with all calculated An/Ap ratios were simulated.
Oxide-Based TE Module
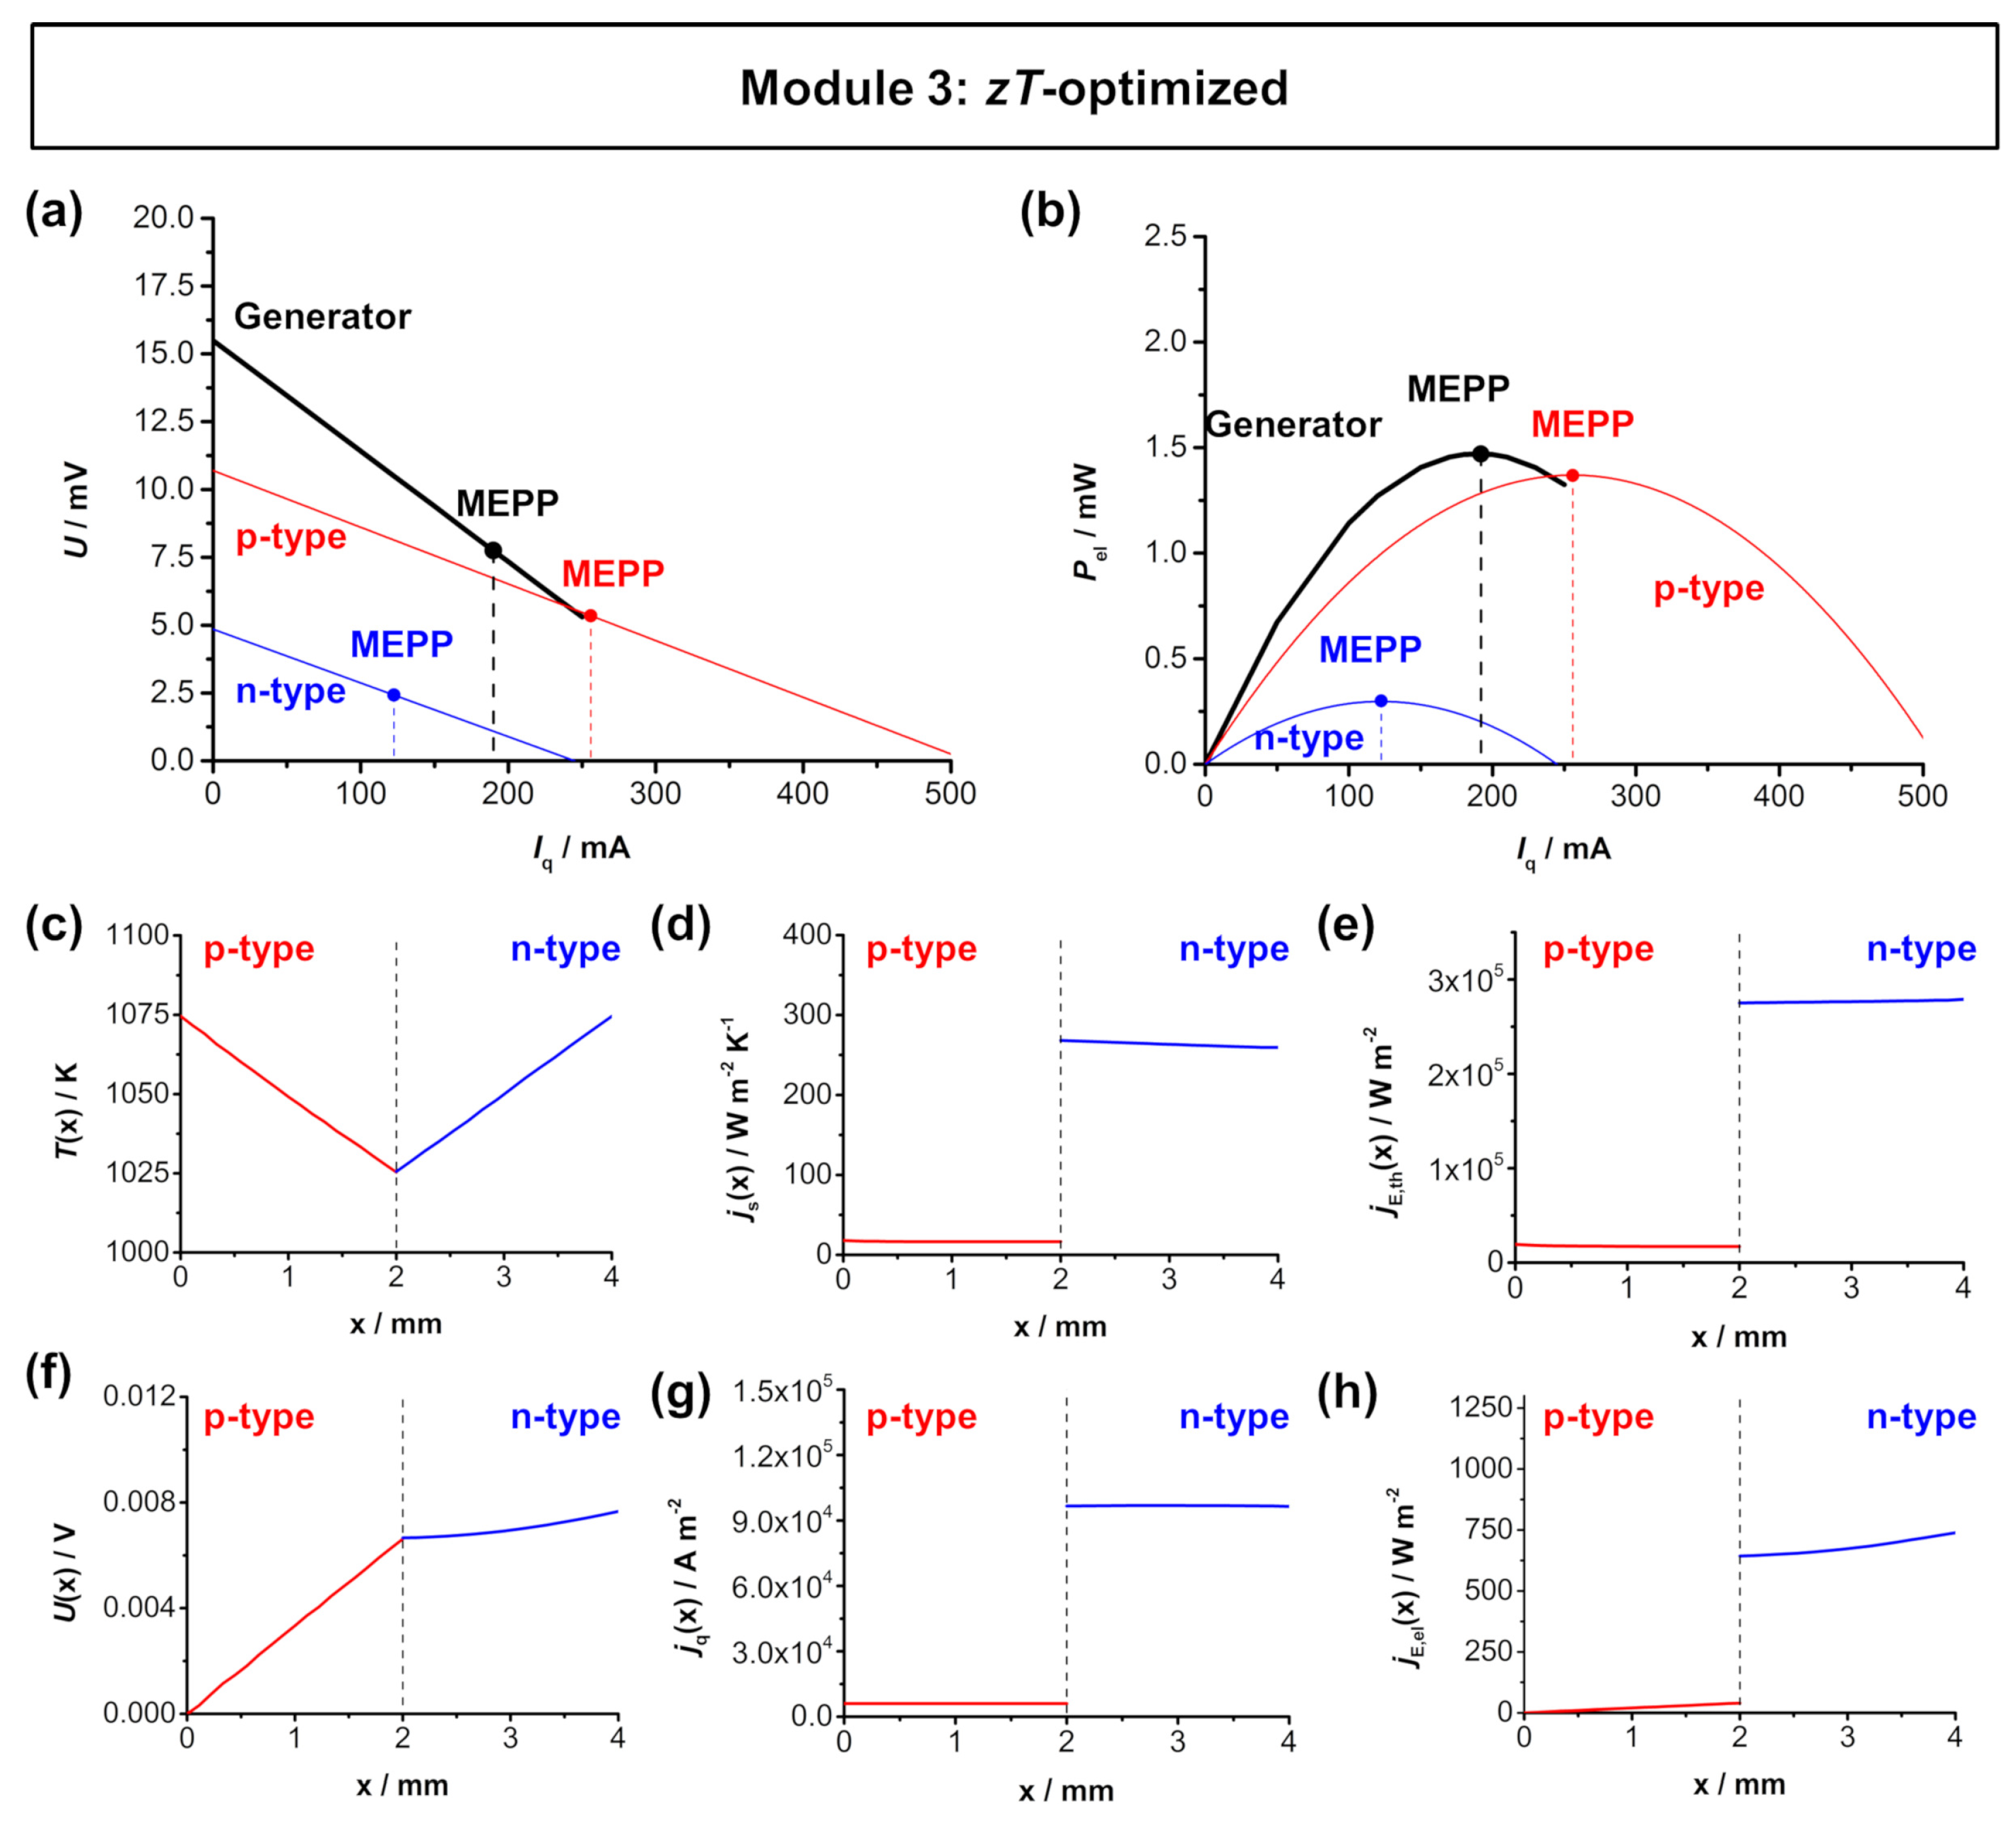
Figure 5 shows the simulated U-Iq characteristics and the electrical power output of the Ca3Co4O9-In1.95Sn0.05O2 TE module and the thermoelectric parameters across the length of the respective legs. Here, the zT optimization of the An/Ap ratio does not result in an overlap of the respective material working points. The short-circuited electrical current Iq,SC of the p-type Ca3Co4O9 is approximately twice the short-circuited current Iq,SC of the n-type In1.95Sn0.05O2. Therefore, the resulting MEPP of the TE module is located between the respective material working points, and the power output of the module is only slightly higher when compared to the power output of the p-type Ca3Co4O9 leg. With an effective area of 0.3332 cm2 the simulated TE module reaches a maximum electrical power density el,max,TEG of approximately 4.5 mW cm−2. The individual fluxes within in the p-type and n-type thermolegs are shown in Figure 4c–h. The temperature difference was again set to 50 K, with a hot side temperature of 1075 K and a cold side temperature of 1025 K. The strong difference of the Seebeck coefficient of n- and p-type materials is displayed in the distribution of the voltage U(x). In the p-type material, a voltage of 6.6 mV is reached, while, in the n-type material, the voltage only increases by 1 mV to 7.6 mV. The strong difference of thermoelectric properties of p- and n-type materials is also displayed in the flux density of charge and flux density of entropy, both being higher in the n-type In1.995Sn0.05O3 due to the higher electrical and thermal conductivity. Therefore, the same behavior is noticeable in the flux densities of thermal energy and electrical energy.
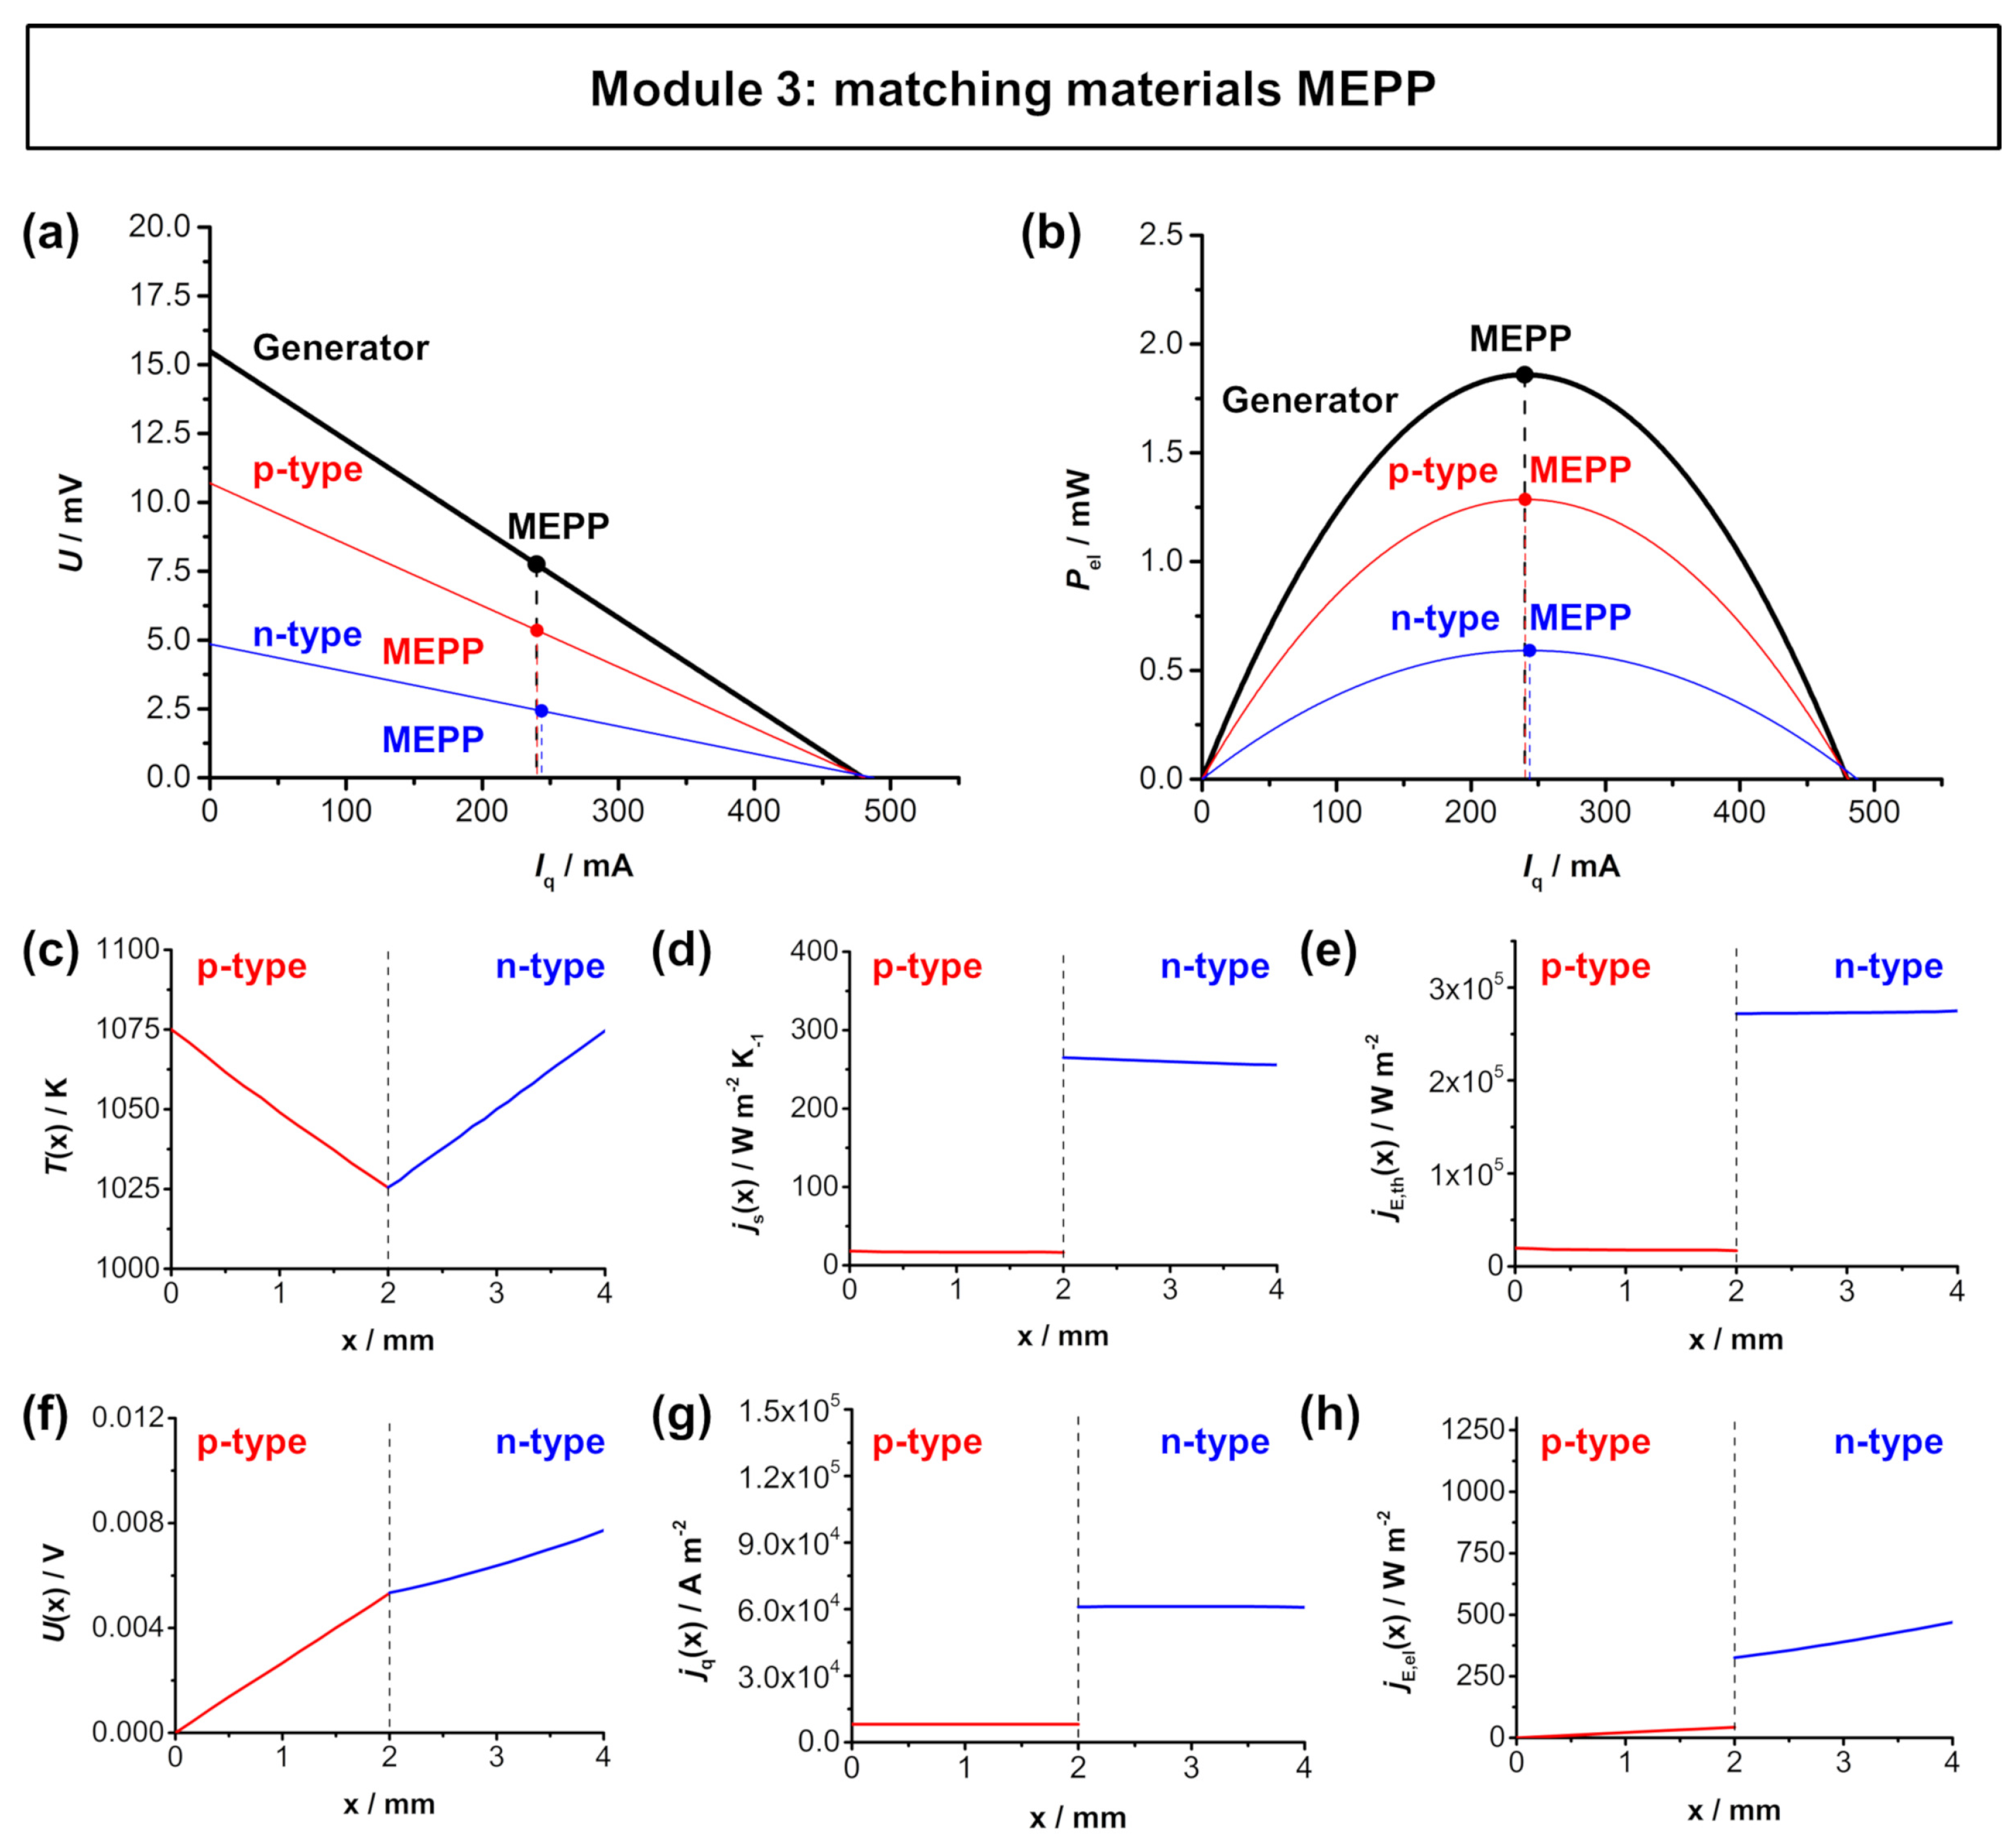
Figure 6 shows the simulated U-Iq characteristics and the electrical power output of the Ca3Co4O9–In1.95Sn0.05O2 TE module and the respective thermoelectric parameters across the length of the respective legs for an optimized An/Ap ratio for matching Iq,SC. As a result of this optimization, the module MEPP is also similar to the both materials’ working points and the power output of the module is already significantly higher than of the respective materials. With an effective area of 0.333 cm2 a maximum electrical power density el,max,TEG of approximately 5.64 mW cm−2 can be reached. The individual fluxes within in the p-type and n-type thermolegs for the module optimized for matching Iq,SC are shown in Figure 6c–h. When compared to the zT optimization, the larger area of the n-type In1.995Sn0.05O3 results in a bigger impact of the material, displayed in a higher value of voltage reached in the n-type material. Additionally, both the entropy flux density (slightly) as well as the electrical flux density (significantly) of the n-type material are lower, due to the larger area, which results in the same trend for the flux densities of thermal energy and electrical energy.
Finally, in Figure 7, the power optimization of the An/Ap ratio according to Equation (7) is shown. Again, the material working points do not overlap, but as a result of the increasing cross-sectional area of the n-type In1.95Sn0.05O2, the electrical power output of the the n-type material is significantly higher compared to the other two optimization strategies. In fact, both materials reach a similar electrical power output Pel,max of about 1 mW, resulting in a maximum electrical power output Pel,max,TEG of about 2 mW for the module. This corresponds to a maximum electrical power density el,max,TEG of 5.89 mW cm−2. The individual fluxes within in the p-type and n-type thermolegs for the power-optimized module are shown in Figure 7c–h. Here, the trend from the module optimized for matching Iq,SC continues. The larger area of the n-type material results in a higher voltage U(x) and as well as decreasing flux densities of entropy jS(x) (slightly lower) and charge jq(x) (significantly lower).
Table 4 summarizes the simulated characteristics of the zT-optimized Ca3Co4O9-In1.95Sn0.05O2 TE module, the optimized module for matching Iq,SC, as well as for the power-optimized geometry. The module with power-optimized An/Ap ratio reaches a maximum power density of 5.89 mW cm−2, which is slightly higher compared to the module with overlapping material working points and about 30% higher when compared to the module with zT-optimized geometry. Additionally, the maximum first-law energy conversion efficiency I,TEG,max for all three optimized geometries have been calculated. As expected, the zT-optimized module reaches the highest I,TEG,max with 0.13%, while the module optimized for matching Iq,SC and the power-optimized module show slightly lower efficiencies of 0.11% and 0.09%, respectively. This shows the contrary trend of a higher efficiency (for the zT-optimized module) and of higher power density (for the power-optimized module).
As a result, module 3 is build based on the same materials with identical thermoelectric properties, but it is either optimized for maximum zT, matching Iq,SC or maximum power output. Figure 8 summarizes the results of all three optimization strategies. The zT optimization leads to a module with the highest conversion efficiency, but the lowest electrical power output. Contrary, the power optimization leads to a module with the the highest electrical power output, but the lowest conversion efficiency. The module with optimized geometry for matching Iq,SC is in between, but closer to the maximum electrical power output. This also corresponds to the results of Xing et al. [36], who observed a similar increase in the maximum electrical power output with a respective geometry optimization when compared to an optimization for maximum zT. Note that this correlation between the deviation of optimum power output and optimum conversion efficiency is here shown on the example of module 3, but also applies for the other TE modules. As shown in Table 2, the optimum An/Ap ratio for the Bi2Te3-based module 1 and the half-Heusler-based module 2 also varies slightly for the different optimization strategies. Therefore, also for quite similar thermoelectric materials, a slight deviation between optimum power output and energy conversion efficiency can be expected.
4. Conclusions
Three different optimization strategies for the An/Ap ratio were applied, whereas, for certain modules, they all resulted in different geometries. For module 3, based on strongly dissimilar thermoelectric properties of the p-type Ca3Co4O9 and the n-type In1.95Sn0.05O3, the geometry optimizations show strongly dissimilar An/Ap ratios. Here, a strong deviation between high conversion efficiency (with zT-optimized geometry) and high power output (with power-optimized geometry) was found. The power optimization resulted in a 30% higher power output compared to the zT-optimized counterpart. For modules with more similar thermoelectric properties of the n- and p-type, which, in this work, are the Bi2Te3-based module 1 and the half-Heusler-based module 2, the respective optimum geometries only differ slightly, but also show this deviation in the geometry optimization. This emphasizes that, for TE module concepts, various optimization strategies may be applied, either to target high conversion efficiency or high power output. This phenomena correlates to the diversity of the thermoelectric materials that were used for the TE module. Additionally, this also underlines the similar importance of the power factor of thermoelectric materials, to target a high power output, when compared to the figure of merit zT.
Author Contributions
M.W., R.H. and A.F. worked on the conceptualization. A.R. developed the methods and carried out the simulations. M.W. wrote the original draft. All authors critically revised and edited the manuscript draft. A.F. is responsible for the acquisition of funding. All authors have read and agreed to the published version of the manuscript.
Funding
This work was funded by the Deutsche Forschungsgemeinschaft (DFG, German Research Foundation)—project number 325156807. The publication of this article was funded by the Open Access fund of Leibniz University Hannover.
Conflicts of Interest
The authors declare no conflict of interest.
Abbreviations
The following abbreviations are used in this manuscript:
| TE module | thermoelectric module |
| TEG | thermoelectric generator |
| MCEP | maximum conversion efficiency point |
| MEPP | maximum electrical power point |
| OC | (electrical) open-circuit |
| SC | (electrical) short-circuit |
Symbols
The following symbols are used in this manuscript:
Geometry
| A | cross-sectional area of thermoelectric material |
| An | cross-sectional area of n-type material |
| Ap | cross-sectional area of p-type material |
| l | length of thermoelectric material |
| ln | length of n-type material |
| lp | length of p-type material |
| ratio of the cross-sectional areas of the n-type and p-type materials | |
| ratio of the cross-sectional areas of the n-type and p-type materials for maximum zT | |
| ratio of the cross-sectional areas of the n-type and p-type materials for matching Iq,SC | |
| ratio of the cross-sectional areas of the n-type and p-type materials for maximum power |
Material properties
| Seebeck coefficient | |
| n | Seebeck coefficient of n-type material |
| p | Seebeck coefficient of p-type material |
| n | heat conductivity of n-type material |
| p | heat conductivity of p-type material |
| OC | heat conductivity under electrically open-circuited (OC) conditions |
| OC | entropy conductivity under electrically open-circuited (OC) conditions |
| specific electrical resistivity | |
| n | specific electrical resistivity of n-type material |
| p | specific electrical resistivity of p-type material |
| Rn | resistance of n-type material |
| Rp | resistance of p-type material |
| isothermal electrical conductivity | |
| f | figure of merit (as introduced by Zener [43] |
| figure of merit (as introduced by Ioffe [10]) |
Thermodynamic potentials
| electric potential | |
| T | absolute temperature |
| Tcold | temperature of the thermoelectric material at its cold side |
| Thot | temperature of the thermoelectric material at its hot side |
| gradient of the temperature | |
| difference of temperature (along the thermoelectric material) | |
| U | voltage |
| UOC | voltage at electrically open-circuited (OC) conditions |
Fluxes
| i | normalized electrical current |
| Iq | electrical current |
| Iq,SC | electrical current at electrically short-circuited (SC) conditions |
| q | electrical flux density |
| s | entropy flux density |
| E,el | electrical energy flux density |
| E,th | thermal energy flux density |
| q | electric charge |
| S | entropy |
Performance
| Pel,max | maximum electrical power output of the thermoelectric material (at MEPP) |
| Pel,max,TEG | maximum electrical power output of the module (at MEPP) |
| el,max,TEG | maximum electrical power density of the module (at MEPP) |
| Iq,MEPP | current Iq at the MEPP |
| Iq,MEPP,n | current Iq at the MEPP of the n-type material |
| Iq,MEPP,p | current Iq at the MEPP of the p-type material |
| UMEPP,TEG | voltage U at the MEPP of the TE module |
| Iq,MEPP,TEG | current Iq at the MEPP of the TE module |
| RTEG | internal resistance of the TE module |
| II,mat | second-law energy conversion efficiency of a thermoelectric material |
| I,TEG,max | maximum first-law energy conversion efficiency of the TE module |
| Carnot | Carnot efficiency of the TE module |
| II,TEG,max | maximum second-law energy conversion efficiency of the TE module |
Appendix A. Input Data for FEM-Simulation

Table A1.
Thermoelectric parameters of module 1 (p-type Bi0.5Sb1.5Te3 [37], n-type Bi2Te3-xSbx [38]) used for FEM simulations. For all material parameters a linear behavior within the applied temperature range has been assumed and the average value has been used for the calculation of the An/Ap ratio.
| p-Type | n-Type | |||
|---|---|---|---|---|
| T/K | 348 | 298 | 348 | 298 |
| /S cm−1 | 760 | 990 | 711 | 875 |
| /V K−1 | 227 | 213 | −228 | −220 |
| OC/W m−1 K−1 | 1.31 | 1.39 | 1.40 | 1.35 |
| OC/W m−1 K−2 | 3.76 × 10⁻³ | 4.66 × 10⁻³ | 4.02 × 10⁻³ | 4.53 × 10⁻³ |
Table A2.
Thermoelectric parameters of module 2 (p-type FeNb0.88Hf0.12Sb [39], n-type Hf0.6Zr0.4NiSn0.995Sb0.005 [40]) used for FEM simulations. For all material parameters a linear behavior within the applied temperature range has been assumed and the average value has been used for the calculation of the An/Ap ratio.
| p-Type | n-Type | |||
|---|---|---|---|---|
| T/K | 1000 | 950 | 1000 | 950 |
| /S cm−1 | 1053 | 1158 | 960 | 1000 |
| /V K−1 | 223 | 217 | −212 | −219 |
| OC/W m−1 K−1 | 4.33 | 4.44 | 4.16 | 3.90 |
| OC/W m−1 K−2 | 4.33 × 10⁻³ | 4.76 × 10⁻³ | 4.16 × 10⁻³ | 4.11 × 10⁻³ |
Table A3.
Thermoelectric parameters of module 3 (p-type Ca3Co4O9 [41], n-type In1.95Sn0.05O3 [41]) used for FEM simulations. For all material parameters a linear behavior within the applied temperature range has been assumed and the average value has been used for the calculation of the An/Ap ratio.
| p-Type | n-Type | |||
|---|---|---|---|---|
| T/K | 1075 | 1025 | 1075 | 1025 |
| /S cm−1 | 29.63 | 31.48 | 609.26 | 448.15 |
| /V K−1 | 202.83 | 225.74 | −100.94 | −92.45 |
| OC/W m−1 K−1 | 0.63 | 0.66 | 10.70 | 10.94 |
| OC/W m−1 K−2 | 0.59 × 10⁻³ | 0.64 × 10⁻³ | 9.95 × 10⁻³ | 10.67 × 10⁻³ |
Appendix B. An/Ap Optimization for Matching Short-Circuit Current
Here, the optimized An/Ap ratio for matching Iq,SC is derived. The idea of this optimization is as follows: the working points of the respective thermoelectric materials overlap, if the flux of charge in both materials is the same. Then, the working points of the materials overlap, so
By including
and
with the electrical resistance of the materials
and
the following relation is received:
After rearrangement and with the assumed same length of the thermolegs ln=lp the result for a An/Ap ratio for matching Iq,SC is:
Appendix C. An/Ap Optimization for Maximum Power
The maximum power output of a TE module is a function of the electrical current Iq of the module at the MEPP Iq,MEPP,TEG and the voltage U of the module at the MEPP UMEPP,TEG, which are calculated according to Equations (A8) and (A9):
From this, the maximum electrical power output of a module at the MEPP can be derived as
with the internal electrical resistance of the module RTEG
Considering, that the effecive area A is a sum of the cross-sectional areas An and Ap, Equation (A11) can be differentiated and has to be equal 0 for its maximum. So
This Equation (A12) is zero, if the numerator of the fraction is zero, so
After rearrangement, the optimum An/Ap ratio for maximum power output is received as
Appendix D. Efficiency of the Module
The maximum first-law efficiency I,TEG,max of a module is the product of the Carnot efficiency Carnot and the second-law efficiency II,TEG,max [9,11] and can be determined as
Here, is the average temperature and Z is a function of the materials thermoelectric parameters:
with
and
So, the maximum first-law efficiency I,TEG,max of a module can be determined as a function of the materials thermoelectric parameter and the respective cross-sectional areas An and Ap [30].
Appendix E. Simulated Module Fluxes
Figure A1.
Analyzed path x along a central line through the respective thermoleg on the example of module 1.
Figure A1.
Analyzed path x along a central line through the respective thermoleg on the example of module 1.

Figure A2.
Distribution of (a) temperature T(x), (b,c) flux density of thermal energy jE,th(x), (d) voltage U(x) and (e,f) flux density of electrical charge jq(x) in module 1.
Figure A2.
Distribution of (a) temperature T(x), (b,c) flux density of thermal energy jE,th(x), (d) voltage U(x) and (e,f) flux density of electrical charge jq(x) in module 1.

Figure A3.
Distribution of (a) temperature T(x), (b,c) flux density of thermal energy jE,th(x), (d) voltage U(x) and (e,f) flux density of electrical charge jq(x) in module 2.
Figure A3.
Distribution of (a) temperature T(x), (b,c) flux density of thermal energy jE,th(x), (d) voltage U(x) and (e,f) flux density of electrical charge jq(x) in module 2.

Figure A4.
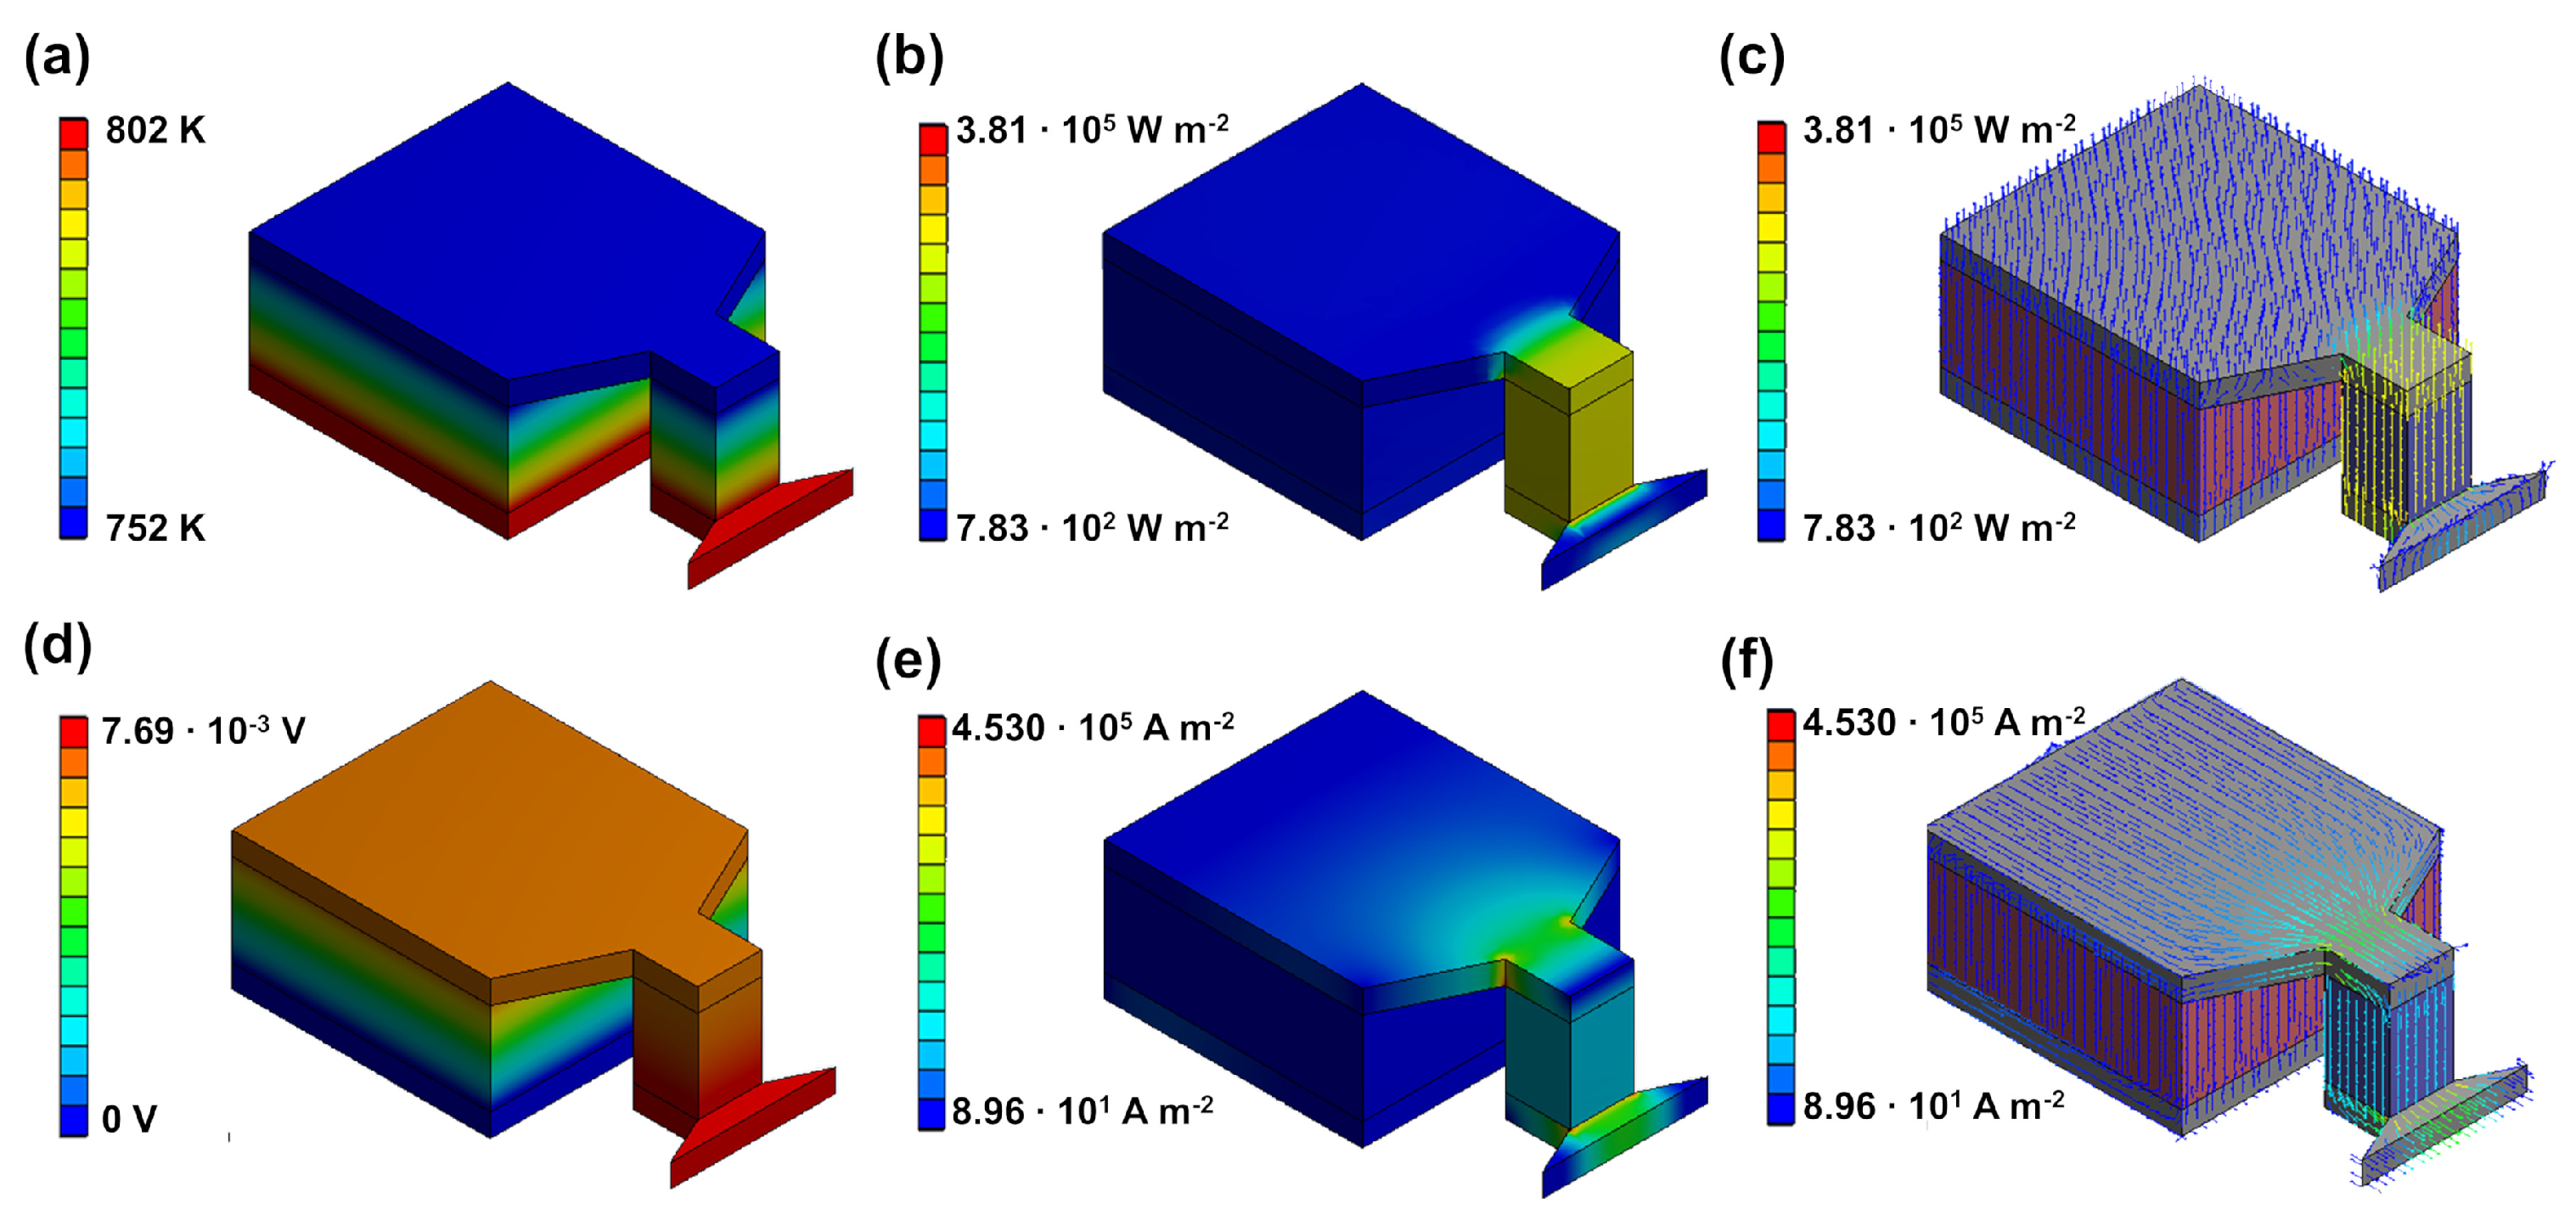
Distribution of (a) temperature T(x), (b,c) flux density of thermal energy jE,th(x), (d) voltage U(x) and (e,f) flux density of electrical charge jq(x) in module 3 with zT-optimized geometry.
Figure A4.
Distribution of (a) temperature T(x), (b,c) flux density of thermal energy jE,th(x), (d) voltage U(x) and (e,f) flux density of electrical charge jq(x) in module 3 with zT-optimized geometry.

Figure A5.
Distribution of (a) temperature T(x), (b,c) flux density of thermal energy jE,th(x), (d) voltage U(x) and (e,f) flux density of electrical charge jq(x) in module 3 with geometry for matching Iq,SC.
Figure A5.
Distribution of (a) temperature T(x), (b,c) flux density of thermal energy jE,th(x), (d) voltage U(x) and (e,f) flux density of electrical charge jq(x) in module 3 with geometry for matching Iq,SC.

Figure A6.
Distribution of (a) temperature T(x), (b,c) flux density of thermal energy jE,th(x), (d) voltage U(x) and (e,f) flux density of electrical charge jq(x) in module 3 with power-optimized geometry.
Figure A6.
Distribution of (a) temperature T(x), (b,c) flux density of thermal energy jE,th(x), (d) voltage U(x) and (e,f) flux density of electrical charge jq(x) in module 3 with power-optimized geometry.

References
- Kishore, R.A.; Marin, A.; Wu, C.; Kumar, A.; Priya, S. Energy Harvesting—Materials, Physics, and System Design with Practical Examples; DEStech Publications: Boston, MA, USA; Berlin, Germany, 2019. [Google Scholar]
- Wolf, M.; Hinterding, R.; Feldhoff, A. High Power Factor vs. High zT—A Review of Thermoelectric Materials for High-Temperature Application. Entropy 2019, 21, 1058. [Google Scholar] [CrossRef] [Green Version]
- Gayner, C.; Kar, K.K. Recent Advances in Thermoelectric Materials. Prog. Mater. Sci. 2016, 83, 330–382. [Google Scholar] [CrossRef]
- He, R.; Schierning, G.; Nielsch, K. Thermoelectric Devices: A Review of Devices, Architectures, and Contact Optimization. Adv. Mater. Technol. 2018, 3. [Google Scholar] [CrossRef] [Green Version]
- Liu, X.; Wang, Z. Printable Thermoelectric Materials and Applications. Front. Mater. 2019, 6, 1–5. [Google Scholar] [CrossRef]
- He, W.; Zhang, G.; Zhang, X.; Ji, J.; Li, G.; Zhao, X. Recent Development and Application of Thermoelectric Generator and Cooler. Appl. Energy 2015, 143, 1–25. [Google Scholar] [CrossRef]
- Fuchs, H.U. A Direct Entropic Approach to Uniform and Spatially Continuous Dynamical Models of Thermoelectric Devices. Energy Harvest. Syst. 2014, 1, 1–18. [Google Scholar] [CrossRef]
- Feldhoff, A. Thermoelectric Material Tensor Derived from the Onsager-de Groot-Callen Model. Energy Harvest. Syst. 2015, 2, 5–13. [Google Scholar] [CrossRef]
- Fuchs, H. The Dynamics of Heat—A Unified Approach to Thermodynamics and Heat Transfer, 2nd ed.; Springer: New York, NY, USA, 2010. [Google Scholar] [CrossRef]
- Ioffe, A.F. Semiconductor Thermoelements, and Thermoelectric Cooling, 1st ed.; Info-search Ltd.: London, UK, 1957. [Google Scholar] [CrossRef] [Green Version]
- Feldhoff, A. Power Conversion and its Efficiency in Thermoelectric Materials. Entropy 2020, 22, 803. [Google Scholar] [CrossRef]
- Mamur, H.; Bhuiyan, M.R.; Korkmaz, F.; Nil, M. A Review on Bismuth Telluride (Bi2Te3) Nanostructure for Thermoelectric Applications. Renew. Sustain. Energy Rev. 2018, 82, 4159–4169. [Google Scholar] [CrossRef]
- Guo, W.; Ma, J.; Zheng, W. Bi2Te3 Nanoflowers Assembled of Defective Nanosheets with Enhanced Thermoelectric Performance. J. Alloy. Compd. 2016, 659, 170–177. [Google Scholar] [CrossRef]
- Zhang, J.; Wu, D.; He, D.; Feng, D.; Yin, M.; Qin, X.; He, J. Extraordinary Thermoelectric Performance Realized in n-Type PbTe through Multiphase Nanostructure Engineering. Adv. Mater. 2017, 29, 1–7. [Google Scholar] [CrossRef] [PubMed]
- Zhao, L.D.; Lo, S.H.; Zhang, Y.; Sun, H.; Tan, G.; Uher, C.; Wolverton, C.; Dravid, V.P.; Kanatzidis, M.G. Ultralow Thermal Conductivity and High Thermoelectric Figure of Merit in SnSe Crystals. Nature 2014, 508, 373–377. [Google Scholar] [CrossRef] [PubMed]
- Peng, K.; Lu, X.; Zhan, H.; Hui, S.; Tang, X.; Wang, G.; Dai, J.; Uher, C.; Wang, G.; Zhou, X. Broad Temperature Plateau for High zTs in Heavily Doped p-Type SnSe Single Crystals. Energy Environ. Sci. 2016, 9, 454–460. [Google Scholar] [CrossRef]
- Shuai, J.; Mao, J.; Song, S.; Zhang, Q.; Chen, G.; Ren, Z. Recent Progress and Future Challenges on Thermoelectric Zintl Materials. Mater. Today Phys. 2017, 1, 74–95. [Google Scholar] [CrossRef]
- Sun, J.; Singh, D.J. Thermoelectric Properties of AMg2X2, AZn2Sb2 (A = Ca, Sr, Ba; X = Sb, Bi), and Ba2ZnX2 (X = Sb, Bi) Zintl Compounds. J. Mater. Chem. A 2017, 5, 8499–8509. [Google Scholar] [CrossRef]
- Chen, X.; Wu, H.; Cui, J.; Xiao, Y.; Zhang, Y.; He, J.; Chen, Y.; Cao, J.; Cai, W.; Pennycook, S.J.; et al. Extraordinary Thermoelectric Performance in n-Type Manganese Doped Mg3Sb2 Zintl: High Band Degeneracy, Tuned Carrier Scattering Mechanism and Hierarchical Microstructure. Nano Energy 2018, 52, 246–255. [Google Scholar] [CrossRef]
- Zhu, H.; He, R.; Mao, J.; Zhu, Q.; Li, C.; Sun, J.; Ren, W.; Wang, Y.; Liu, Z.; Tang, Z.; et al. Discovery of ZrCoBi Based Half Heuslers with High Thermoelectric Conversion Efficiency. Nat. Commun. 2018, 9, 1–9. [Google Scholar] [CrossRef]
- Poon, S.J. Half-Heusler Compounds: Promising Materials For Mid-To-High Temperature Thermoelectric Conversion. J. Phys. D Appl. Phys. 2019, 52, 493001. [Google Scholar] [CrossRef] [Green Version]
- Yin, Y.; Tudu, B.; Tiwari, A. Recent Advances in Oxide Thermoelectric Materials and Modules. Vacuum 2017, 146, 356–374. [Google Scholar] [CrossRef]
- Zhang, X.; Chang, C.; Zhou, Y.; Zhao, L.D. BiCuSeO Thermoelectrics: An Update on Recent Progress and Perspective. Materials 2017, 10, 198. [Google Scholar] [CrossRef]
- Cowen, L.M.; Atoyo, J.; Carnie, M.J.; Baran, D.; Schroeder, B.C. Review—Organic Materials for Thermoelectric Energy Generation. ECS J. Solid State Sci. Technol. 2017, 6, N3080–N3088. [Google Scholar] [CrossRef] [Green Version]
- Boudouris, B.W.; Yee, S. Structure, Properties and Applications of Thermoelectric Polymers. J. Appl. Polym. Sci. 2017, 134. [Google Scholar] [CrossRef] [Green Version]
- Ashalley, E.; Chen, H.; Tong, X.; Li, H.; Wang, Z.M. Bismuth Telluride Nanostructures: Preparation, Thermoelectric Properties and Topological Insulating Effect. Front. Mater. Sci. 2015, 9, 103–125. [Google Scholar] [CrossRef]
- Gharsallah, M.; Serrano-Sánchez, F.; Bermúdez, J.; Nemes, N.M.; Martínez, J.L.; Elhalouani, F.; Alonso, J.A. Nanostructured Bi2Te3 Prepared by a Straightforward Arc-Melting Method. Nanoscale Res. Lett. 2016, 11, 4–10. [Google Scholar] [CrossRef] [Green Version]
- Kim, K.; Kim, G.; Lee, H.; Lee, K.H.; Lee, W. Band Engineering and Tuning Thermoelectric Transport Properties of p-type Bi0.52Sb1.48Te3 by Pb Doping for Low-Temperature Power Generation. Scr. Mater. 2018, 145, 41–44. [Google Scholar] [CrossRef]
- Ming, T.; Wu, Y.; Peng, C.; Tao, Y. Thermal Analysis on a Segmented Thermoelectric Generator. Energy 2015, 80, 388–399. [Google Scholar] [CrossRef]
- Ouyang, Z.; Li, D. Modelling of Segmented High-Performance Thermoelectric Generators with Effects of Thermal Radiation, Electrical and Thermal Contact Resistances. Sci. Rep. 2016, 6, 1–12. [Google Scholar] [CrossRef]
- Korotkov, A.S.; Loboda, V.V.; Makarov, S.B.; Feldhoff, A. Modeling Thermoelectric Generators Using the ANSYS Software Platform: Methodology, Practical Applications, and Prospects. Russ. Microelectron. 2017, 46, 131–138. [Google Scholar] [CrossRef]
- Oshima, K.; Inoue, J.; Sadakata, S.; Shiraishi, Y.; Toshima, N. Hybrid-Type Organic Thermoelectric Materials Containing Nanoparticles as a Carrier Transport Promoter. J. Electron. Mater. 2017, 46, 3207–3214. [Google Scholar] [CrossRef]
- Culebras, M.; Igual-Muñoz, A.M.; Rodríguez-Fernández, C.; Gómez-Gómez, M.I.; Gómez, C.; Cantarero, A. Manufacturing Te/PEDOT Films for Thermoelectric Applications. ACS Appl. Mater. Interfaces 2017, 9, 20826–20832. [Google Scholar] [CrossRef]
- Wolf, M.; Menekse, K.; Mundstock, A.; Hinterding, R.; Nietschke, F.; Oeckler, O.; Feldhoff, A. Low Thermal Conductivity in Thermoelectric Oxide-Based Multiphase Composites. J. Electron. Mater. 2019, 48, 7551–7561. [Google Scholar] [CrossRef]
- Narducci, D. Do we Really Need High Thermoelectric Figures of Merit? A Critical Appraisal to the Power Conversion Efficiency of Thermoelectric Materials. Appl. Phys. Lett. 2011, 99. [Google Scholar] [CrossRef] [Green Version]
- Xing, Z.; Liu, R.; Liao, J.; Wang, C.; Zhang, Q.; Song, Q.; Xia, X.; Zhu, T.; Bai, S.; Chen, L. A-Device-To-Material Strategy Guiding the “Double-High” Thermoelectric Module. Joule 2020. [Google Scholar] [CrossRef]
- Poudel, B.; Hao, Q.; Ma, Y.; Lan, Y.; Minnich, A.; Yu, B.; Yan, X.; Wang, D.; Muto, A.; Vashaee, D.; et al. High-Thermoelectric Performance of Nanostructured Bismuth Antimony Telluride Bulk Allys. Science 2008, 320, 634–638. [Google Scholar] [CrossRef] [Green Version]
- Kim, H.S.; Kikuchi, K.; Itoh, T.; Iida, T.; Taya, M. Design of Segmented Thermoelectric Generator Based on Cost-Effective and Light-Weight Thermoelectric Alloys. Mater. Sci. Eng. B Solid State Mater. Adv. Technol. 2014, 185, 45–52. [Google Scholar] [CrossRef]
- Fu, C.; Bai, S.; Liu, Y.; Tang, Y.; Chen, L.; Zhao, X.; Zhu, T. Realizing High Figure of Merit in Heavy-Band p-Type half-Heusler Thermoelectric Materials. Nat. Commun. 2015, 6, 1–7. [Google Scholar] [CrossRef] [PubMed] [Green Version]
- Chen, L.; Gao, S.; Zeng, X.; Mehdizadeh Dehkordi, A.; Tritt, T.M.; Poon, S.J. Uncovering High Thermoelectric Figure of Merit in (Hf,Zr)NiSn half-Heusler Alloys. Appl. Phys. Lett. 2015, 107, 041902. [Google Scholar] [CrossRef] [Green Version]
- Bittner, M.; Geppert, B.; Kanas, N.; Singh, S.P.; Wiik, K.; Feldhoff, A. Oxide-Based Thermoelectric Generator for High-Temperature Application Using p-Type Ca3Co4O9 and n-Type In1.95Sn0.05O3 Legs. Energy Harvest. Syst. 2016, 3, 213–222. [Google Scholar] [CrossRef]
- Bergman, T.L.; Lavine, A.S.; Incropera, F.P.; DeWitt, D.P. Fundamentals of Heat and Mass Transfer, 7th ed.; John Wiley & Sons: Hoboken, NJ, USA, 2011; p. 8. [Google Scholar]
- Zener, C. Putting Electrons to Work. Trans. ASM 1961, 53, 1052–1068. [Google Scholar]
Figure 1.
Normalized U-Iq and Pel-Iq characteristics of some hypothetic thermoelectric materials with a zT of 0.5, 1, 2, and 4. The second-law energy conversion efficiency II,mat increases with increasing figure of merit zT. The maximum conversion efficiency point (MCEP) is a function of the figure of merit zT and, therefore, drifts apart from the maximum electrical power point (MEPP). Working points of short-circuit (SC) with the short-circuit current Iq,SC and open-circuit (OC) with the open-circuit voltage UOC are marked. Reworked from [11].

Figure 2.
Resulting modules characterized via finite elemente simulations (FEM)-simulations. (a) Bi2Te3-based TE module 1, (b) half-Heusler-based TE module 2, and (c) oxide-based TE module 3 with three different An/Ap ratios. The colors refer to the respective temperatures (red: hot side, blue: cold side). Note that the effective area An + Ap is constant for all modules and An/Ap ratios. As connector, the characteristics of copper has been used in the simulation.

Figure 3.
FEM simulations of module 1 (p-type Bi0.5Sb1.5Te3 and n-type Bi2Te3-xSbx) with a hot side temperature of 348 K and cold side temperature of 298 K. (a) U-Iq characteristics and (b) electrical power output Pel–Iq of the module. The respective MEPPs of the materials overlap and result in a high power output of the TE module. Thermoelectric characteristics of the respective materials as a function of the length of the respective legs: (c) temperature T(x), (d) entropy flux density jS(x), (e) thermal energy flux density jE,th(x), (f) voltage U(x), (g) electrical flux density jq(x), and (h) electrical energy flux density jE,el(x) trend throughout one thermocouple. Note that the dashed line in (c–h) represents the metallic connector between the p-type and n-type materials. The simulated distributions are shown in Figure A2 in Appendix E.

Figure 4.
FEM simulations of module 2 (p-type FeNb0.88Hf0.12Sb and n-type Hf0.6Zr0.4NiSn0.995Sb0.005) with a hot side temperature of 1000 K and cold side temperature of 950 K. (a) U-Iq characteristics and (b) electrical power output Pel–Iq of the module. The respective MEPPs of the materials overlap and result in a high power output of the module. Thermoelectric characteristics of the respective materials as a function of the length of the respective legs: (c) temperature T(x), (d) entropy flux density jS(x), (e) thermal energy flux density jE,th(x), (f) voltage U(x), (g) electrical flux density jq(x), and (h) electrical energy flux density jE,el(x) trend throughout one thermocouple. Note that the dashed line in (c–h) represent the metallic connector between the p-type and n-type materials. The simulated distributions are shown in Figure A3 in Appendix E.

Figure 5.
FEM simulations of the zT-optimized module 3 (p-type Ca3Co4O9 and n-type In1.95Sn0.05O3) with a hot side temperature of 1050 K and cold side temperature of 1000 K. (a) U-Iq characteristics and (b) electrical power output Pel-Iq of the module. Thermoelectric characteristics of the respective materials as a function of the length of the respective legs: (c) temperature T(x), (d) entropy flux density jS(x), (e) thermal energy flux density jE,th(x), (f) voltage U(x), (g) electrical flux density jq(x), and (h) electrical energy flux density jE,el(x) trend throughout one thermocouple. Note, that the dashed line in (c–h) represent the metallic connector between the p-type and n-type materials. The simulated distributions are shown in Figure A4 in Appendix E.

Figure 6.
FEM simulations of the module 3 (p-type Ca3Co4O9 and n-type In1.95Sn0.05O3) with matching Iq,SC with a hot side temperature of 1050 K and cold side temperature of 1000 K. (a) U–Iq characteristics and (b) electrical power output Pel-Iq of the module. Thermoelectric characteristics of the respective materials as a function of the length of the respective legs: (c) temperature T(x), (d) entropy flux density jS(x), (e) thermal energy flux density jE,th(x), (f) voltage U(x), (g) electrical flux density jq(x), and (h) electrical energy flux density jE,el(x) trend throughout one thermocouple. Note, that the dashed line in (c–h) represent the metallic connector between the p-type and n-type materials. The simulated distributions are shown in Figure A5 in Appendix E.

Figure 7.
FEM simulations of the power-optimized module 3 (p-type Ca3Co4O9 and n-type In1.95Sn0.05O3) with a hot side temperature of 1050 K and cold side temperature of 1000 K. (a) U-Iq characteristics and (b) electrical power output Pel-Iq of the module. Thermoelectric characteristics of the respective materials as a function of the length of the respective legs: (c) temperature T(x), (d) entropy flux density jS(x), (e) thermal energy flux density jE,th(x), (f) voltage U(x), (g) electrical flux density jq(x), and (h) electrical energy flux density jE,el(x) trend throughout one thermocouple. Note, that the dashed line in (c–h) represent the metallic connector between the p-type and n-type materials. The simulated distributions are shown in Figure A6 in Appendix E.

Figure 8.
Comparison of all three optimization strategies for module 3 (dash: zT-optimized, dash-dot: matching Iq,SC, line: power-optimized). The power-optimized module shows a significantly higher power output when compared to zT-optimized module. The module with overlapping material working points is in between, but closer to the maximum power output.

Table 1.
Material combinations for the simulated modules with according literature for the thermoelectric properties. The exact input values are shown in Table A1, Table A2 and Table A3 in Appendix A. For all modules, a stable temperature difference of 50 K has been assumed. For the calculation of the An/Ap ratios, a linear behavior has been assumed and the calculation was done with the medium values of the respective temperature range.
| Module | p-Type | n-Type | Thot/K | Tcold/K |
|---|---|---|---|---|
| Module 1 | Bi0.5Sb1.5Te3 [37] | Bi2Te3-xSbx [38] | 348 | 298 |
| Module 2 | FeNb0.88Hf0.12Sb [39] | Hf0.6Zr0.4NiSn0.995Sb0.005 [40] | 1000 | 950 |
| Module 3 | Ca3Co4O9 [41] | In1.95Sn0.05O3 [41] | 1075 | 1025 |
Table 2.
Resulting optimized geometries according to the zT optimization, matching Iq,SC and power optimization. For the values in brackets, no simulations were carried out, due to insignificant deviation from the zT optimization.
Table 2.
Resulting optimized geometries according to the zT optimization, matching Iq,SC and power optimization. For the values in brackets, no simulations were carried out, due to insignificant deviation from the zT optimization.
| Module | []zT | []matching Iq,SC | []power |
|---|---|---|---|
| Module 1 | 1.0345 | (1.0745) | (1.0459) |
| Module 2 | 1.0831 | (1.0969) | (1.0308) |
| Module 3 | 0.0596 | 0.1306 | 0.2433 |
Table 3.
Resulting maximum electrical power output Pel,max,TEG, electrical power density el,max,TEG and maximum first-law energy conversion efficiency I,TEG,max of module 1 (Bi2Te3) and module 2 (half-Heusler materials) for zT-optimized geometry.
Table 3.
Resulting maximum electrical power output Pel,max,TEG, electrical power density el,max,TEG and maximum first-law energy conversion efficiency I,TEG,max of module 1 (Bi2Te3) and module 2 (half-Heusler materials) for zT-optimized geometry.
| Module | Module MEPP/A | Pel,max,TEG/mW | el,max,TEG/mW cm−2 | I,TEG,max |
|---|---|---|---|---|
| Module 1 | 3.75 | 41.60 | 124.50 | 2.50 |
| Module 2 | 4.72 | 51.10 | 153.14 | 0.97 |
Table 4.
Resulting maximum electrical power output Pel,max,TEG, electrical power density el,max,TEG, and maximum first-law energy conversion efficiency I,TEG,max of module 3 with optimized geometry for maximum zT, matching Iq,SC and maximum power output. The resulting power density increases due to the overlapping material working points.
| Module | Module MEPP/mA | Pel,max,TEG/mW | el,max,TEG/mW cm−2 | I,TEG,max |
|---|---|---|---|---|
| zT-optimized | 189.90 | 1.50 | 4.51 | 0.13% |
| same Iq,SC | 239.89 | 1.86 | 5.64 | 0.11% |
| power-optimized | 252.00 | 1.96 | 5.89 | 0.09% |
Publisher’s Note: MDPI stays neutral with regard to jurisdictional claims in published maps and institutional affiliations. |
© 2020 by the authors. Licensee MDPI, Basel, Switzerland. This article is an open access article distributed under the terms and conditions of the Creative Commons Attribution (CC BY) license (http://creativecommons.org/licenses/by/4.0/).
Share and Cite
MDPI and ACS Style
Wolf, M.; Rybakov, A.; Hinterding, R.; Feldhoff, A. Geometry Optimization of Thermoelectric Modules: Deviation of Optimum Power Output and Conversion Efficiency. Entropy 2020, 22, 1233. https://doi.org/10.3390/e22111233
AMA Style
Wolf M, Rybakov A, Hinterding R, Feldhoff A. Geometry Optimization of Thermoelectric Modules: Deviation of Optimum Power Output and Conversion Efficiency. Entropy. 2020; 22(11):1233. https://doi.org/10.3390/e22111233
Chicago/Turabian StyleWolf, Mario, Alexey Rybakov, Richard Hinterding, and Armin Feldhoff. 2020. "Geometry Optimization of Thermoelectric Modules: Deviation of Optimum Power Output and Conversion Efficiency" Entropy 22, no. 11: 1233. https://doi.org/10.3390/e22111233
Note that from the first issue of 2016, this journal uses article numbers instead of page numbers. See further details here.