1. Introduction
Supercritical water gasification bases were provided for the first time at the end of the 1970s when Michael Modell studied the production of a syngas with a high concentration of hydrogen that could potentially be used as a synthetic fuel [
1]. Working beyond the critical temperature and pressure (374 °C and 220 bar), the concentration of gaseous products depends on the operating conditions employed, such as temperature, pressure, residence time, feedstock concentration, etc. [
2,
3]. Many types of feedstock, such as biomass, organic waste, plastic, coal, sludge and slurry, etc., have been studied in previous decades achieving different results and optimizing the condition to maximize the production of syngas or fuel gases [
4,
5,
6,
7,
8].
Despite the effort made by the scientific community up to nowadays, the scale up from laboratory to industrial level is still not fully established. Initially, several works at pilot scale were reported (
Table 1), highlighting the VERENA pilot plant constructed by Forschungszentrum Karlsruhe [
9,
10]. The usual operating flowrate was 50 kg/h with a temperature of approximately 660 °C and a pressure of 280 bar. Since its construction in the 2000s, the pilot plant has been working to provide a better understanding of SCWG; however, several challenges are still to be solved [
11]. The Pacific Northwest National Laboratory developed a process known as the Thermochemical Environmental Energy System (TEES) [
12] and demonstrated it in a continuous pilot scale operation with a nominal flowrate of 38 L/h. In China, the State Key Laboratory of Multiphase Flow in Power Engineering (SKLMF) developed several tubular reactor systems and the first fluidized bed reactor in supercritical water with the aim of solving the plugging problems due to the high concentration of organic compounds in the used feedstock, such as wet biomass, sewage sludge, or thermoset plastics [
13,
14,
15,
16,
17,
18]. The University of Twente in collaboration with BTG B.V. designed and built a pilot plant in a concrete high pressure safety box. It was designed for temperatures up to 650 °C and pressures of 300 bar with a treatment capacity of 30 kg/h [
19]. In Japan, Chugoku Electric Power in collaboration with Hiroshima University developed a pilot plant to generate flammable gas from chicken manure [
20,
21], and the results showed an almost complete gasification of the feedstock, achieving a process efficiency of 70% or higher. A few years ago, the University of Delft in collaboration with Gensos constructed a pilot scale plant of biomass in a fluidized bed. The plant has a capacity of 50 kg/h and reaches temperatures of 600 °C at 240 bar [
22]. At present, the HydroPilot project has started to run a pilot plant demonstration promoted by the Paul Scherrer Institute and the Fachhochschule Nordwestschweiz [
23]. The capacity of this pilot system is 100 kg/h of wet biomass, working under a pressure from 280 to 300 bar and temperatures of approximately 400 °C.
In spite of the successful demonstration in continuous pilot scale plants, at the industrial level, there are no well-known cases with reported results. Casademont et al. [
24] conducted a patent review to analyze the most significant invention since 1995. This review shows the technical limitations and the large investment needed for industrial plant operation that currently limits the feasibility and subsequent commercial implementation of SCWG technology. To increase economic feasibility, energy recovery, and integration of power generation devices are proposed as the key to optimizing operation and reducing costs.
From the energy viewpoint, one of the most important obstacles in supercritical processes is the energy required to achieve supercritical conditions (more than 374 °C and 220 bar). Industrial processes, where flowrates are high, boost the demanded energy necessary to operate the plant. Plant start-up prior to reaching steady-state operation is the step where a peak of energy should be supplied. Thus, energy recovery and heat integration in plants are key concepts that must be considered in the design and configuration steps of these plants. In this way, SKLMF researchers have analyzed different thermodynamic modeling at the simulation level to improve heat integration and power generation [
25,
26]. Additionally, to improve the economic feasibility of SCWG technologies, different studies on energy supplies have been reported. One of the most important advances was developed by a team from SKLMF to produce hydrogen from biomass by using SCWG technology promoted by solar energy. First, different systems were constructed and tested at the laboratory scale for proof-of-concept tests, based on concentrated solar energy processes with dish and toroidal surface heliostats [
27,
28]. Then, the first SCWG pilot plant based on solar energy was built [
29,
30,
31] to analyze the possibilities of its commercialization. The KTH Royal Institute in Stockholm [
32,
33] was working at the simulation level on integrating the gasification technology (under non-supercritical conditions, to ensure the procurement of high conversion efficiency) with the supercritical water technology (to produce a clean syngas with low content of contaminants, such as tars, sour gas, and alkali compounds, necessary to feed the fuel cell). The product gas is routed to subsequent processes, including SOFC. Rainey et al., from Queensland University, carried out a study considering different possibilities of energy integration and process-energy configuration to increase the economic viability of the process. To do that, several alternative technologies, such as solar thermal technology (solar thermal and parabolic trough collector), natural gas combustion, and electrical energy, were analyzed [
34]. Pie et al., from the Australian National University, also integrated the concentrated solar thermal technology to drive SCWG plants and its combination with the Fischer–Tropsch process [
35,
36].
At the same time, alternative ways were followed to try to move forward in the feasibility of SCWG by integrating it with other technologies, such as supercritical water oxidation (SCWO), hydrothermal liquefaction (HTL), or anaerobic digestion (AD), to improve, especially, the energy term. Wang et al. [
37] developed a combined SCWG-SCWO system based on a cool-wall reactor. From the treatment of the sewage sludge, syngas was obtained from SCWG, while SCWO operated with the residual organic liquid to produce a harmless product and release heat. De Gisi et al. [
38] worked on agricultural waste treatment (composed of buffalo sewage and maize silicate) by examining the potential of coupling SCWG and AD in a dual system. A liquid digestate fraction of AD is fed to the SCWG reactor to obtain biogas and value-added products, such as formic acid, xylitol, etc. Xu et al. [
39] combined the HTL and SCWG to improve the recovery energy from algal biomass. The aqueous phase generated from HTL is entered the SCWG autoclave reactor for 60 min at 600 °C. This integration could improve energy recovery between 5.53% and 18.30%.
Among all the work carried out and the advances achieved in operating parameters conditions, equipment material and design or feedstock-treated energy requirements and economic feasibility in SCWG plants are actually limiting the industrial implantation of the technology. In order to explore new possibilities and alternative ways to improve that, the present work tackles the limitation of plant scale-up by proposing new energy supplies and integrated systems based on hybridization with conventional and renewable technologies.
To the best knowledge of the authors, not many studies have reported an energy analysis of SCWG hybridization with combined heat and power technologies as a way to increase the viability of these plants while its use is promoted. Hence, this paper deepens the analysis of feasible configurations with the proposed technologies with the aim of obtaining a general overview of the potential possibilities to increase the profitability of SCWG technology on a larger scale.
2. Simulation Methodology
The analysis was carried out by simulation using Aspen Plus.
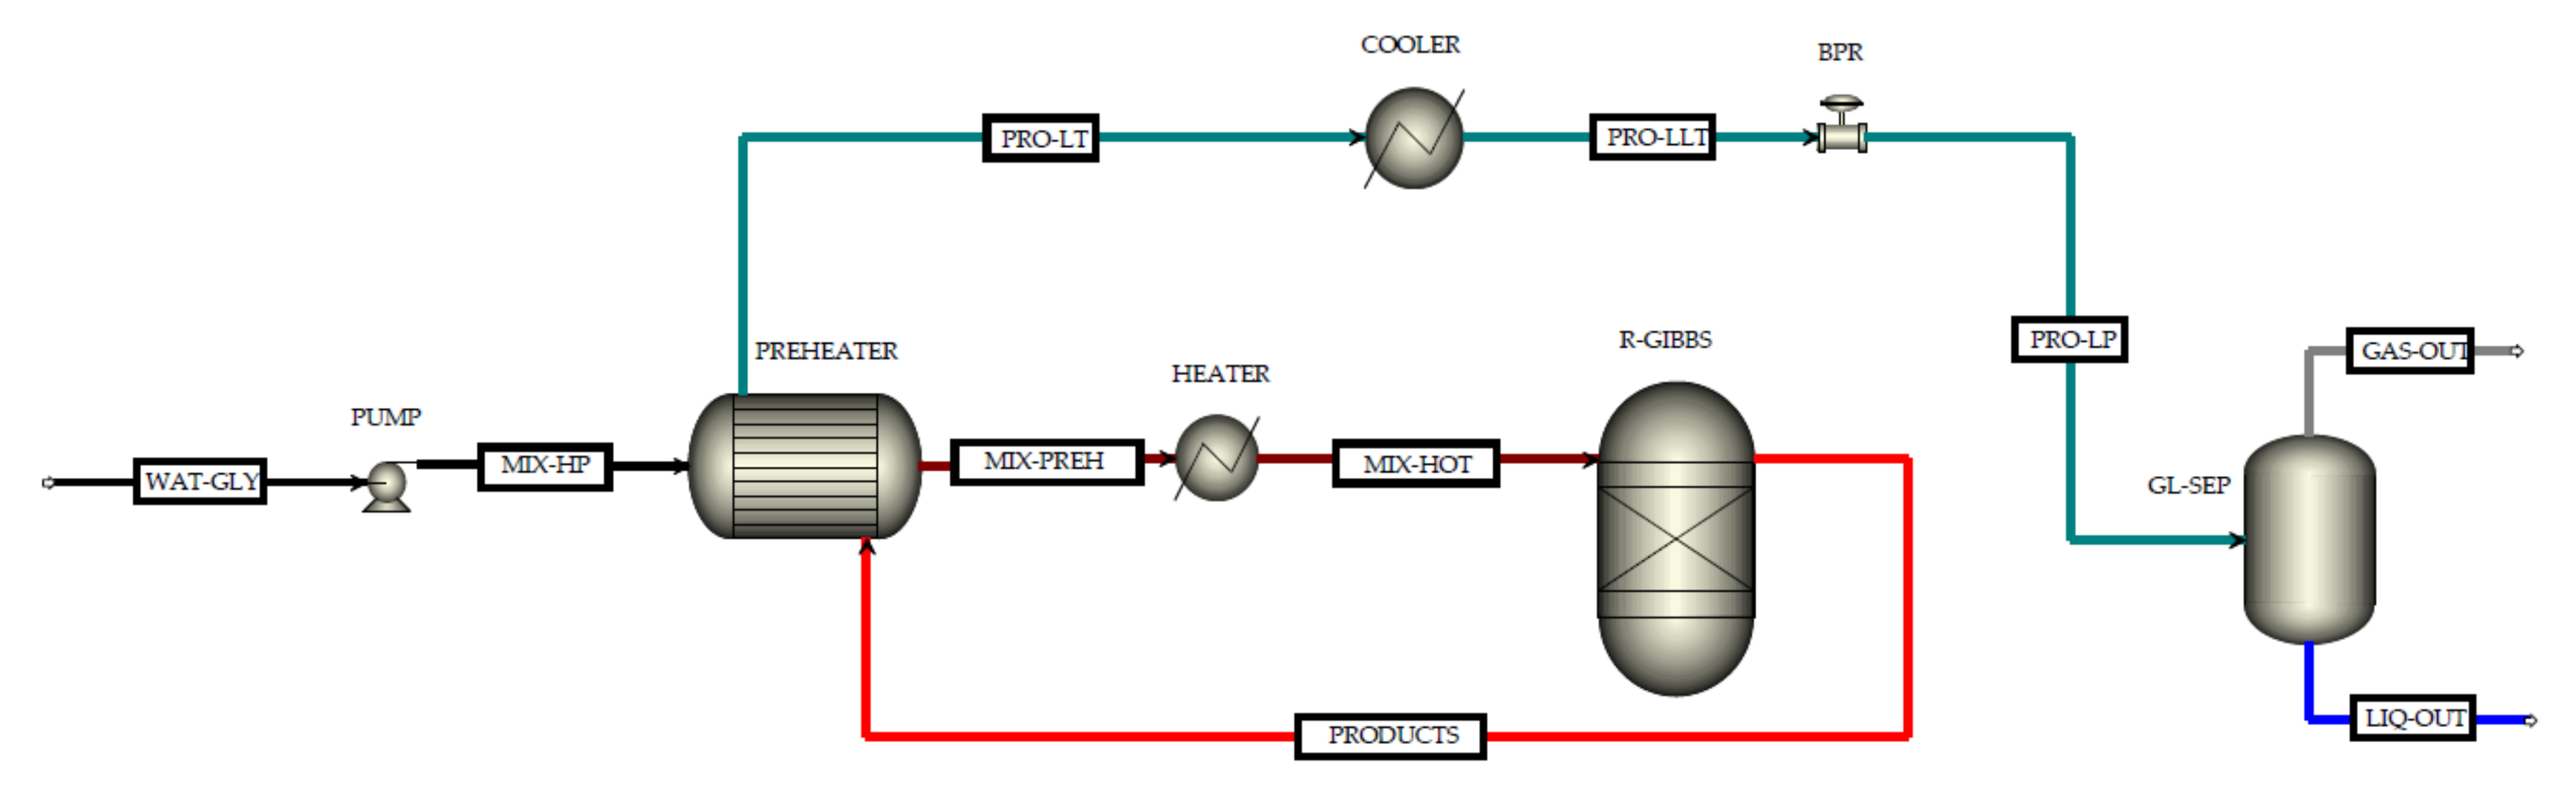
Figure 1 depicts the flowsheet of the simulated plant (base scenario), including a pumping section to obtain supercritical pressure, a preheating step to reach the supercritical temperatures, a further preheating to the reaction temperature, the gasification in a tubular reactor, as well as the cooling and depressurization to reduce the temperature and pressure, respectively. Finally, separation processes are required to obtain clean syngas.
In this plant, the hot effluent leaving the reactor (hot fluid) feeds a heat exchanger (preheater) to increase the temperature of the feed (cold fluid) after pressurizing from atmospheric to 250 bar. This configuration does not allow the energy self-sufficient process and external supply energy (heater) is required to achieve the inlet temperature to the reactor at the setting values in a range between 450 and 600 °C (imposed by the ICE and GT used). The specifications of the process units used in the simulation are shown in
Table 2.
In order to study SCWG plants at the industrial level, and based on the current SCWG plants’ data reported and exposed in the previous section, this work will consider a model plant with a nominal treatment capacity of 1000 kg/h. Therefore, although the main interest of SCWG is the valorization of organic waste, the focus of this work is to analyze the feasibility of hybridizing an SCWG plant through combined power and heat technologies. In this sense, a well-known compound, such as glycerol, is used as a feedstock since numerous experimental tests have been carried out by different research groups and the published results are widely available in the literature [
40,
41,
42]. To calculate the thermodynamic properties of compounds, the equation of state (EOS) used to obtain a better representation of changes in the supercritical region is the predictive Soave–Redlich–Kwong (PSRK) EOS, as reported in the literature [
43]. Pump efficiencies are set at 80%. The preheater is designed as a countercurrent heat exchanger, having a minimum temperature difference between the hot and cold streams set in the range from 5 to 25 °C, depending on each case study’s requirements. The gasification reactor is simulated considering chemical equilibrium based on the Gibbs free energy minimization model, with high isolation that guarantees no heat losses. This methodology is widely used as a powerful tool to solve chemical equilibrium when kinetic data are not available or reliable enough [
44]. The final separation of the gas mixture is modeled by a flash separator. The pressure losses are low and have not been considered in the simulation.
In order to make possible an objective comparison of the results obtained for the proposed case studies, the simulation of the plant configuration corresponding to each case study is carried out considering the common operating parameters shown in
Table 3.
The base scenario is representative of many SCWG plants that take advantage of the hot effluent leaving the reactor to preheat the feed stream. Next, alternative case studies are analyzed by hybridizing this initial scenario with combined power and heat technologies as a means of increasing the energy efficiency of these plants. Thus, this work is focused on alternative heating solutions to the current heater in
Figure 1 by hybridizing this plant with different potential heat sources. For this purpose,
Figure 2 shows a modification of the base scenario, where the preheater is not fed with the reactor effluent. Except for the preheater, both plants have the same components and should be designed to convert as much organic waste as possible. With this new design, there are two main advantages:
Heat from external sources can be used as heat input to the preheater; in this regard, different alternatives can be analyzed.
Full thermal energy at the reactor output is available in the cooler and, therefore, can be used for power generation by organic or steam Rankine cycles.
From this configuration, two different case studies are considered to analyze the hybridization with conventional and renewable technologies. These case studies take advantage of the exhaust gas from an internal combustion engine (ICE) and a gas turbine (GT), respectively. In both cases, external fuel is supplied to feed ICE and GT, and the energy of the effluent leaving the reactor is recovered. In this study, natural gas was used as an external fuel to obtain a more homogeneous benchmark, although natural gas should be replaced by a similar but more sustainable fuel, such as biogas. The composition of this fuel depends on a number of factors that would add uncertainty to the analysis performed and, hence, the more relatively homogeneous natural gas was selected. In a techno-economic assessment, specific biogas should be selected. Finally, a general description of other case studies is also shown as a benchmark for future work, that is, the hybridization with solar energy (parabolic trough concentrators) and solid oxide fuel cells (SOFC). Next, each case study is described in detail.
Case study A: Hybridization with an internal combustion engine (ICE). The exhaust gases and cooling water used to refrigerate the ICE allow the fluid temperature to increase to between 450 and 520 °C. The temperature in ICE exhaust gases, fed with natural gas (NG), biogas, H
2, or mixtures of NG and H
2, can reach between 450 and 550 °C [
45], so there is enough temperature available to heat the feed. In addition, the cooling water used at ICE is limited to 90 °C and can also be used as a previous preheating medium. However, these temperature ranges depend on the operating parameters of the engine, such as the air-to-fuel ratio, the engine timing diagram, or the ICE load, among others. This requires determining an optimum motor configuration to achieve the required fluid temperature.
Case study B: Gas turbine (GT) hybridization, using the exhaust gas stream of the GT, whose temperature can be between 450 °C and 530 °C for the power range achieved, depends on the design parameters of the GT, such as the pressure ratio and the temperature at the combustion chamber outlet. The GT cycle design should guarantee a temperature between 450 and 520 °C in the feed stream with maximum cycle efficiency to optimize the plant performance.
Plant schemes of case studies A and B are represented in
Figure 3. In both configurations, the hot effluent leaving the reactor is fed to a recovery boiler of a Rankine Vapor Cycle or an Organic Rankine Cycle to take advantage of the potential thermal power of the stream. In addition, it is important to emphasize the integration of cogeneration processes (combined heat and power, CHP), clearly encouraged by the current legislation in most countries, as an effective way to increase the energy efficiency of the plant.
Plant configurations for case studies A and B are quite similar, but for case study B only a heat exchanger is used, which is fed by exhaust gases coming from GT to heat the feed stream, while for case study A the heating is performed in two steps (separated heat exchangers) since there are two available heating sources. First, small heating is reached by using the cooling water coming from ICE refrigeration, and then, energy exchanged with the exhaust gases from the ICE combustion allows increasing the temperature of the feed stream to the reactor inlet set point.
3. Results and Discussion
Starting from the base scenario, specific results will be shown for each case study, analyzing the selection of ICE and GT parameters, available thermal energy exchanged in the preheater, electricity generation, and the temperature–thermal power (TQ) curve in the preheater. Mass and energy balances are provided in the
Supplementary Material.
3.1. Base Scenario
This process configuration has been set to obtain the energy requirements of the plant in the base scenario. Demanded energy was parametrized as a function of the inlet temperature of the reactor and the glycerol mass fraction, which was the selected feedstock in this study. Then, the energy exchanged in the preheater, where the effluent from the reactor is the ‘hot fluid’ and the feed stream is the ‘cold fluid’, was analyzed. In the scope of this work, heat exchanger calculations have been performed using a reference value for the overall heat exchanger transfer coefficient (0.85 kW/m
2·K) [
46] and determining the temperature of the two outlet streams based on the heat and material balances. Thus, by imposing a minimum pinch point temperature of 25 °C, an average area is obtained for each glycerol mass fraction considered. This design area is calculated to ensure that there is no temperature cross between hot and cold streams throughout the heat exchanger. The values for the areas ranged from 8.3 m
2 (10 wt.% glycerol) to 8.9 m
2 (30 wt.% glycerol). When selecting these data as the mean value to operate under these conditions, the outlet temperature of the ‘hot fluid’ leaving the preheater ranged from 212 °C to 223 °C.
Figure 4a represents the variation of the thermal power exchanged in the preheater, observing an increase in the thermal power exchanged at low glycerol concentrations. Likewise,
Figure 4b shows the thermal power required in the heater to achieve the reactor inlet temperature set. In this case, the energy requirement decreases as the amount of gasified glycerol increases. The total energy required for heating the feed stream (from ambient conditions) is represented by the sum of the thermal power exchanged in the preheater and that supplied in the heater.
Clearly, the reduction in glycerol concentration and the increase in reactor inlet temperature maximize the exchanged thermal power in the preheater. This result comes from the great influence of the heat capacity variation of the mixture of glycerol and water on the thermal energy exchange.
Figure 5 shows the mass heat capacity of the glycerol–water mixture with a concentration of 10 wt.% and 30 wt.%. There are differences between both concentrations, especially around the supercritical region, where the maximum heat capacity for 10 wt.% glycerol is 30.0 kJ/kg K at 390.1 °C, while for 30 wt.% glycerol, the maximum value decreases to 15.8 kJ/kg K at 406.2 °C.
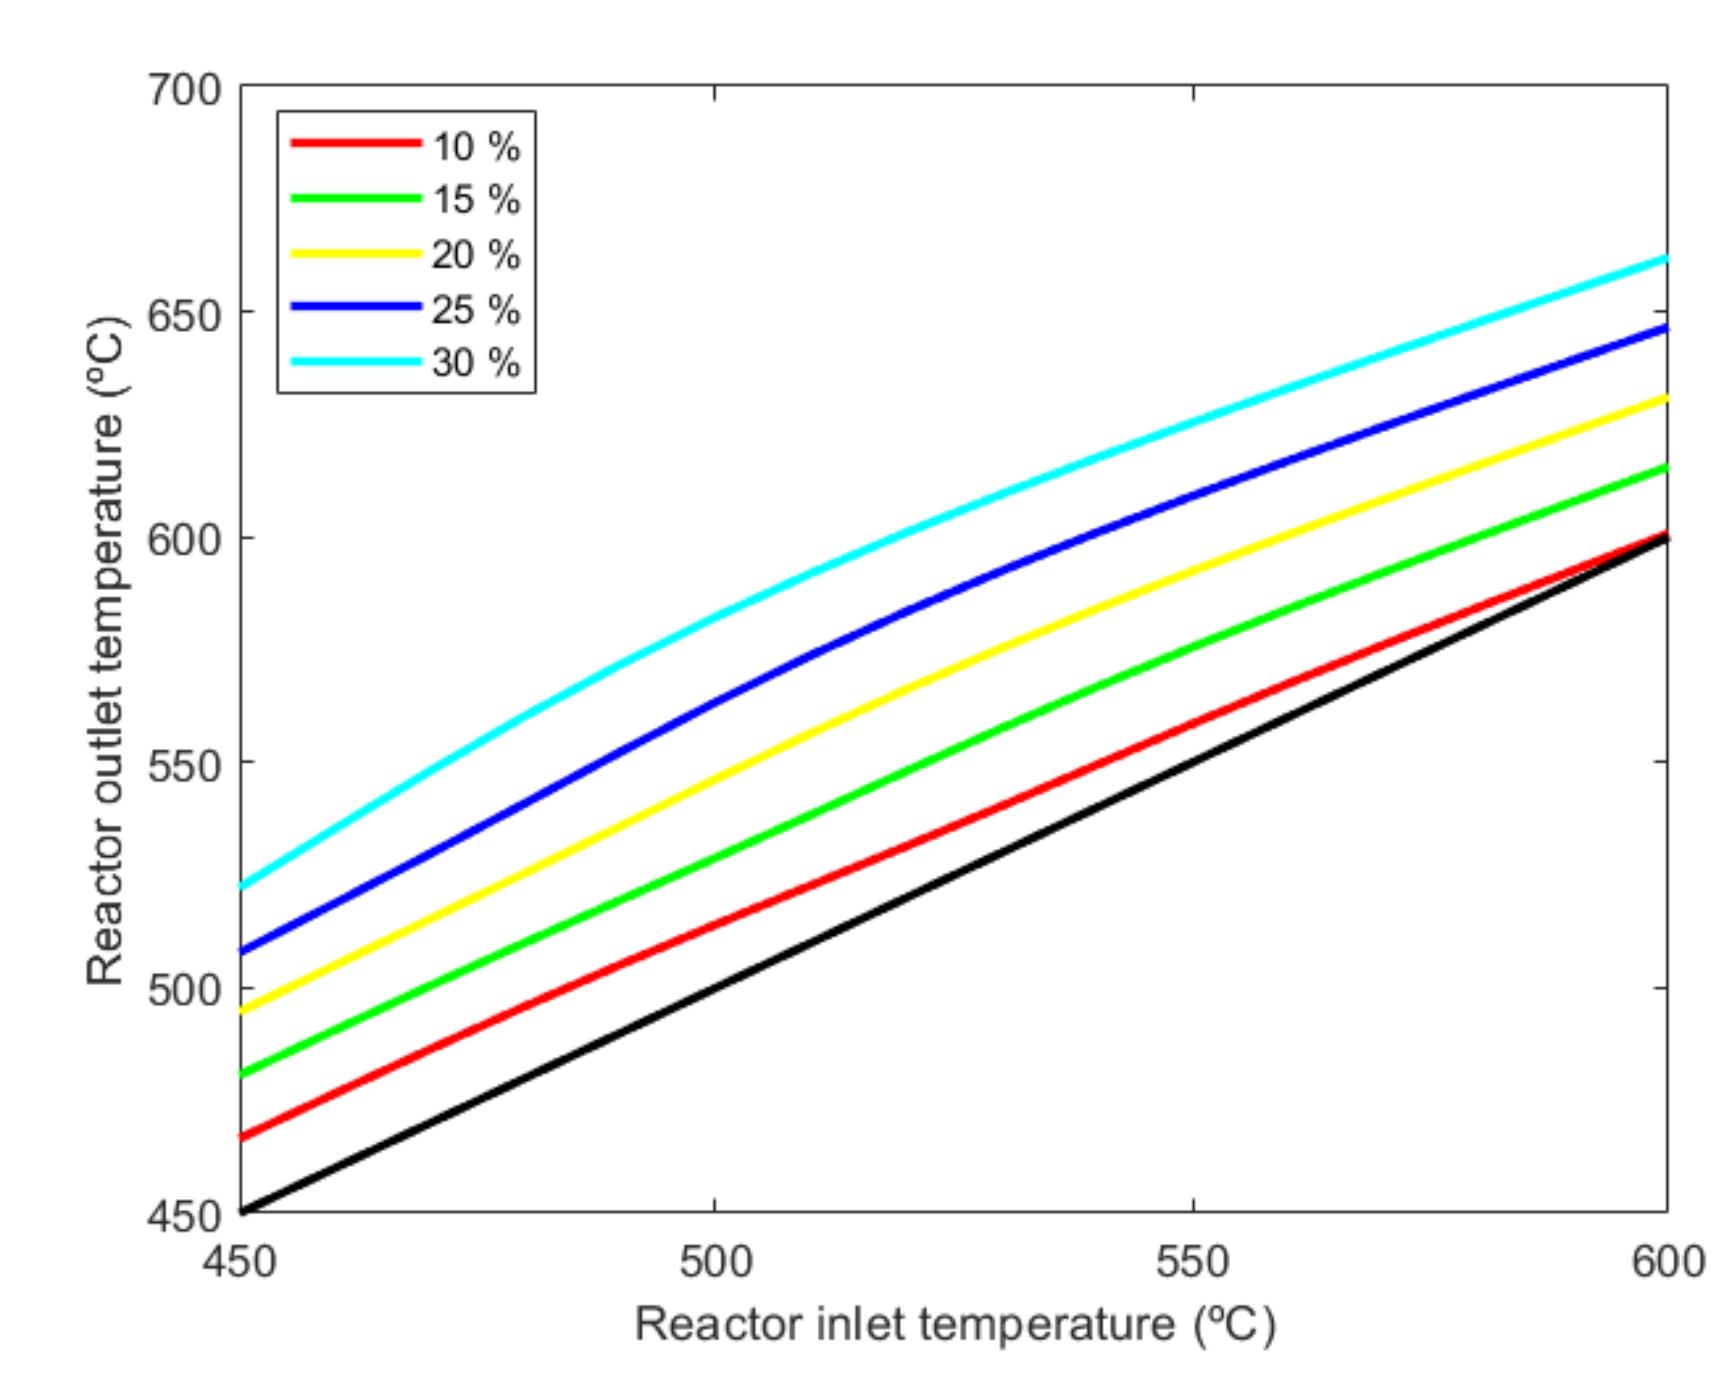
It is also important to analyze the behavior of the outlet temperature of the reactor with respect to the inlet temperature, as shown in
Figure 6. In all cases, there is an increase in the temperature of the reactor outlet stream with respect to the reactor inlet. When the glycerol mass concentration remains constant, this temperature difference decreases as the reactor inlet temperature increases. For example, operating at 20 wt.% glycerol, when the reactor inlet temperature is set at 450 °C, the temperature of the effluent leaving the reactor is 494.1 °C, thus, increasing the temperature in 44.1 °C. However, when the reactor inlet temperature is 600 °C, the temperature at the reactor outlet increases in 30.7 °C. Likewise, when the glycerol concentration increases, the temperature change between the reactor inlet and the outlet increases substantially. For example, operating at the lowest glycerol concentration (10 wt.%), the temperature changes from 15.3 °C to 0.2 °C throughout the reactor, when the reactor inlet temperature varies from 450 to 600 °C, respectively. However, operating at the highest glycerol concentration (30 wt.%), the increase in the reactor temperature is significantly higher, changing from 71.3 °C for a reactor inlet temperature of 450 °C to 61.7 °C when the reactor inlet temperature is 600 °C.
Another important factor to consider in SCWG plants is the production of fuel syngas (H
2, CH
4, and CO) in the gas effluent.
Figure 7a–c shows the hydrogen, methane, and carbon monoxide flowrates, respectively. These results are consistent with experimental results obtained using glycerol as feedstock without catalysts [
41,
42], or using alkali catalysts [
40], or a Ni-based catalyst supported on Al
2O
3 and SiO
2 [
4], where glycerol conversion was almost complete and hydrogen yields were very close to those values predicted by equilibrium at a short residence time, such as achieved in this study. Moreover, the model reliability is in line with other works where Aspen Plus is used for SCWG processes [
47,
48,
49,
50,
51,
52,
53,
54]. As expected, hydrogen production increases when the reactor inlet temperature increases. Furthermore, the increase in hydrogen production for a higher glycerol concentration is more noticeable at higher reactor inlet temperatures. The trend of carbon monoxide is similar to that of hydrogen but with more dependence on the reactor inlet temperature. Likewise, methane production decreases monotonically with the increase in the reactor inlet temperature.
3.2. Case Study A: Hybridization with an ICE (Internal Combustion Engine) Fed with External Fuel
In this case study (
Figure 3), the feed heating to the reaction temperature is reached using exhaust gas and cooling water from an ICE fed with external fuel. Instead, the hot effluent leaving the reactor is used for energy recovery (Organic Rankine Cycle or Vapor Rankine Cycle), and a syngas fuel stream is available for other uses.
Configuration parameters of ICE [
55] were selected considering the thermal power required to heat the feed stream from ambient to the reactor inlet temperature. Exhaust gas has a temperature between 450 °C and 550 °C that will allow a maximum temperature of approximately 530 °C at the reactor inlet (considering 20 °C as the minimum pinch point temperature). Thus, considering an exhaust gas temperature of 550 °C, the required flowrate will vary depending on the operating conditions (different glycerol concentration in the feed stream and temperature at the reactor inlet). For each operating case, the selected ICE will generate the exhaust gas flowrate needed to supply the thermal power demanded by the feed stream. In addition, the cooling water stream coming from the ICE refrigeration is also available with a flowrate from 10 to 23 m
3/h and a temperature of 90 °C. Both streams, exhaust gases and cooling water coming from ICE, are used as hot fluids in the heat exchangers (first and second preheaters) to increase the feed temperature. Taking into account the performance of an ICE in combined heat and power mode, the thermal power of exhaust gases is used to preheat the feed stream process at the same time that the mechanical power generated is also available for electricity generation.
For the first preheater, the cooling water coming from ICE cooling is used as the hot countercurrent fluid in a tube and shell heat exchanger. According to the ICE manufacturer’s data [
55], the maximum temperature in the hot stream is limited to 90 °C, therefore, the design of the equipment is carried out by imposing that the cold fluid is heated up to 85 °C as the maximum temperature (considering the minimum pinch point temperature at 5 °C). The outlet temperature of the hot fluid only decreases a few Celsius degrees because of the high flowrate of cooling water used in the selected ICE. Regarding the thermal power required for each glycerol concentration, the values are similar, since there is a small variation in the heat capacity of the water–glycerol mixture, ranging from 65.25 kW for 10 wt.% glycerol (mixture heat capacity 4.11 kJ/kg K at 85 °C) to 64.90 kW when the glycerol concentration is 30 wt.% (mixture heat capacity 4.05 kJ/kg K at 85 °C). The calculated area of the heat exchanger is almost constant, varying from 3.51 to 3.54 m
2 for the analyzed conditions.
In the second preheater, exhaust gas generated in the ICE is used as countercurrent hot fluid in a tube and shell heat exchanger. Considering a maximum temperature in this stream of 550 °C, the cold stream will be heated from 85 °C, achieved after leaving the first preheater, to 530 °C (considering the minimum pinch point temperature in 20 °C).
Figure 8a shows the thermal energy exchanged between the exhaust gases and the feed stream.
Figure 8b depicts the exhaust gas flowrate required to supply the energy needed to reach the reactor inlet temperature. As expected, an increase in the demanded thermal power leads to an increase in the required exhaust gas flowrate.
For illustrating purposes, the evolution of the hot and cold fluids in the preheater is presented for a concentration of glycerol of 20 wt.% in the feed stream and a reactor inlet temperature of 530 °C (the other conditions are the same as in
Table 3).
Figure 9 shows the TQ curves (temperature–thermal power) for the first preheater (fed with cooling water from ICE) and the second preheater (fed with exhaust gases from ICE), respectively. In the first preheater, the minimum pinch point temperature always occurs at the inlet hot stream and outlet cold stream because the available thermal power in the hot stream is much greater than that required in the cold stream. For the second preheater, the minimum pinch point temperature occurs at the inlet hot stream and outlet cold stream (heat exchanger inlet), although not always. In many cases, where thermal power exchange increases, the minimum pinch point temperature can move to the region where the cold fluid changes to a supercritical state (at an intermediate point from the heat exchange inlet) because of the sharp increase in the fluid heat capacity that flattens the slope of the cold fluid heating curve. However, this curve flattening makes possible a better adaptation of the cold stream curve to the hot stream curve, reducing the temperature difference between them and improving the thermal power exchanged and, thus, the energy efficiency through the heat exchanger. In conventional liquid–vapor heat exchangers, the differences between the cold and the hot curves are greater because the phase change occurs at a constant temperature, resulting in a lower thermal power exchange.
Along with the thermal power exchanged to heat up the feed stream, ICE also supplies mechanical power to generate mechanical (electrical) energy using a fuel-air equivalence ratio equal to 1 for the combustion of natural gas [
55] and an electrical generation yield (η
ICE) of 40% [
55].
Figure 10a shows the generation of ICE electricity depending on the reactor inlet temperature demanded in the plant. In addition, the energy available in the hot effluent that leaves the reactor can be transformed into electricity by organic or vapor cycles. Considering a typical cycle yield of 12% [
55] for the exchange of thermal power,
Figure 10b illustrates the electricity generation under different operating conditions. It can be observed that the electricity generation is greater when the glycerol mass concentration is lower. In
Figure 10a, this occurs because the exchanged thermal energy in the preheaters is higher when the glycerol concentrations are lower due to the higher heat capacity of the mixture previously explained. To cover this increase in the demanded energy, the required exhaust gas flowrate increases and, therefore, the external fuel fed to the ICE increases. Consequently, the generated electricity at a low glycerol mass concentration also increases. In
Figure 10b, there are two opposite effects that affect the properties of effluent leaving the reactor before reaching the cycle. Taking as an example the case where the reactor inlet temperature is 530 °C, on the one hand, the effluent temperature is higher when the glycerol concentration increases, so the outlet temperature reactor is 536 °C at 10 wt.% glycerol, while this temperature increases to 609 °C at 30 wt.% glycerol. On the other hand, the heat capacity of the stream decreases when higher glycerol concentrations are fed, from 3.70 kJ/kg·K at 10 wt.% glycerol to 2.79 kJ/kg·K at 30 wt.% glycerol. This trend is because the effect of heat capacity variation is predominant over the reactor outlet temperature change.
Regarding the syngas stream, operating under the conditions described previously, the H2, CH4, and CO flowrates produced are the same as for the base scenario in the operating temperature range considered, established by the exhaust gases temperature. With these results, the total electrical power generated is the sum of electricity obtained directly from the ICE and the electricity generated in the cycle using the thermal power of the hot effluent leaving the reactor. To evaluate the electrical efficiency, three equations are proposed to show different points of view about products obtained and resources consumed:
Total electrical Power = Electricity from ICE + Electricity from the reactor hot effluent
Electrical Efficiency 1 =
Electrical Efficiency 2 =
Electrical Efficiency 3 = .
The thermal powers of glycerol and natural gas (fuels) are calculated assuming lower heating values of 16 MJ/kg and 47.5 MJ/kg, respectively. To calculate the electrical power generation from the syngas stream produced in the plant, it has been considered the product of the H
2, CH
4, and CO flowrates and each of the corresponding lower heating values (120.0, 50.0, and 10.1 MJ/kg, respectively) and applying an efficiency of 40% [
55].
Taking into account the results shown in
Figure 10, the plant with an ICE could produce a total electrical power in the range from 1612 to 2381 kW with a variable electrical efficiency shown in
Table 4, which includes the main results obtained as a summary for the case where the reactor inlet temperature is 530 °C.
3.3. Case Study B: Hybridization with GT (Gas Turbine) Fed with External Fuel
This case study considers heat recovery in exhaust gases from a GT (fed with external fuel) to heat up the feed stream to supercritical temperatures. As in case study A, the configuration plant for this case corresponds to that shown in
Figure 3, but replacing the ICE by a GT. The selection of the GT model is based on the energy required to heat the feed stream. For each operating conditions, GT will generate an exhaust gas flowrate with a maximum temperature of 530 °C [
55]. This stream is used as ‘hot fluid’ to increase the feed stream (‘cold fluid’) temperature up to the reactor inlet temperature that ranges from 450 °C to 520 °C since a minimum pinch point temperature of 10 °C is considered in the preheater. Moreover, taking into account the performance of a GT in combined heat and power mode, the available mechanical power is also produced for electricity generation [
56].
For this case, in contrast to the previous one, the cold fluid (feed stream) is heated in a single preheater from ambient temperature to 520 °C. The countercurrent hot fluid in the heat exchanger is composed of a variable flowrate of exhaust gases coming from GT with a maximum temperature of 530 °C. The outlet temperature in the hot fluid stream remains in a range from 97 to169 °C depending on the operating conditions.
Figure 11a presents the thermal power exchanged in the preheater to reach the reactor inlet temperature considered. As expected, higher temperatures at the reactor entrance require greater energy exchanges. It is noticeable in terms of the amount of energy required, a significant reduction in the thermal power required when the glycerol mass concentration increases.
Figure 11b shows the exhaust gas flowrate required for each operating condition.
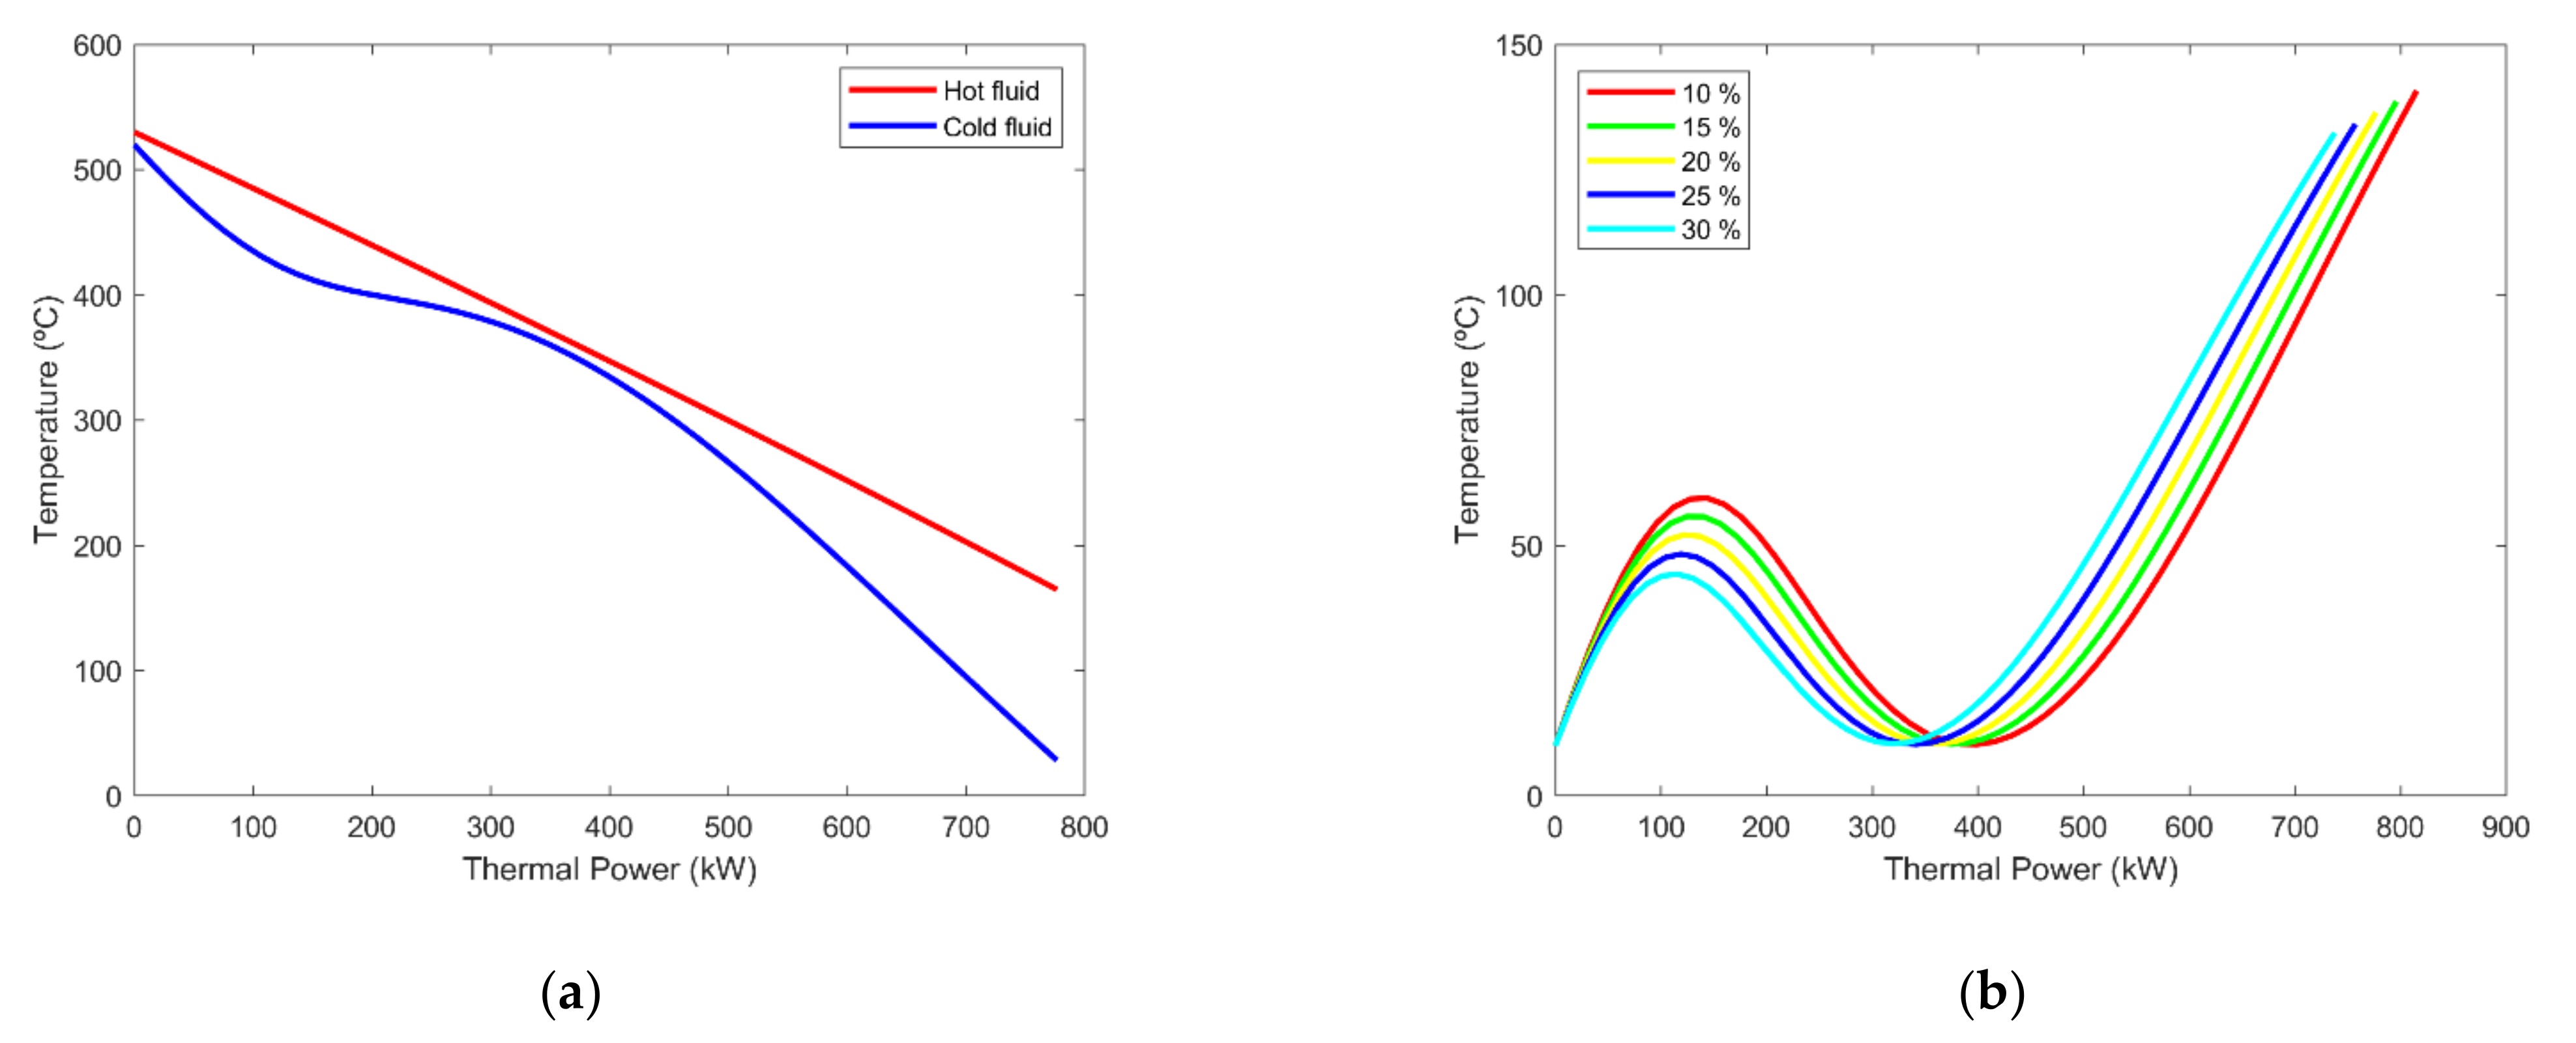
In order to show the behavior of the hot and cold stream along the preheater, the same glycerol concentration used in the previous case study (20 wt.%) is considered. However, the reactor inlet temperature for this case is set at 520 °C and the minimum pinch point temperature at 10 °C. Under these conditions, the TQ curve for the preheater is shown in
Figure 12a. For the hot fluid, the temperature is reduced from 530 °C to 165 °C, while the cold fluid temperature increases from 25 °C to 520 °C. Along the cold fluid curve, the change to the supercritical state that generates a singular curve around the critical temperature can be seen because of the sharp variation in properties. During the preheater design, it is important to control the minimum displacement of the pinch point temperature in this zone by properly selecting the exchange area or the outlet temperature of the hot fluid. This singularity can be seen in
Figure 12b, where the temperature difference between the hot and cold fluids is shown with respect to the exchanged thermal power parametrized for different glycerol concentrations. Keeping in mind
Figure 5, the heat capacity behavior at the lowest glycerol concentration (10 wt.%) reaches a greater maximum value at lower temperatures than at the highest concentration of glycerol (30 wt.%). The evolution of the observed fluid property allows the transition of cold fluid to supercritical phase at lower thermal power when the glycerol concentration increases. For the temperature considered at the reactor inlet (520 °C), the minimum pinch point temperature always occurs at the beginning of the preheater. However, when the temperature at the reactor entrance is below 520 °C, the minimum pinch point temperature is moved to an intermediate point of the preheater (the exchanged thermal power is approximately between 300 and 400 kW) instead of taking place at the entrance.
To calculate the exhaust gas flowrate and the mechanical power produced by the GT, a fuel-air equivalence ratio of 0.319 is considered [
55]. As is well known, this fuel-air equivalence ratio is applied to the whole combustion chamber from an energy balance point of view, although the combustion chamber is designed in such a way that combustion evolves at the stoichiometric fuel-air equivalence ratio. For this case, the electricity generation yield (η
GT) achieves 30% [
55].
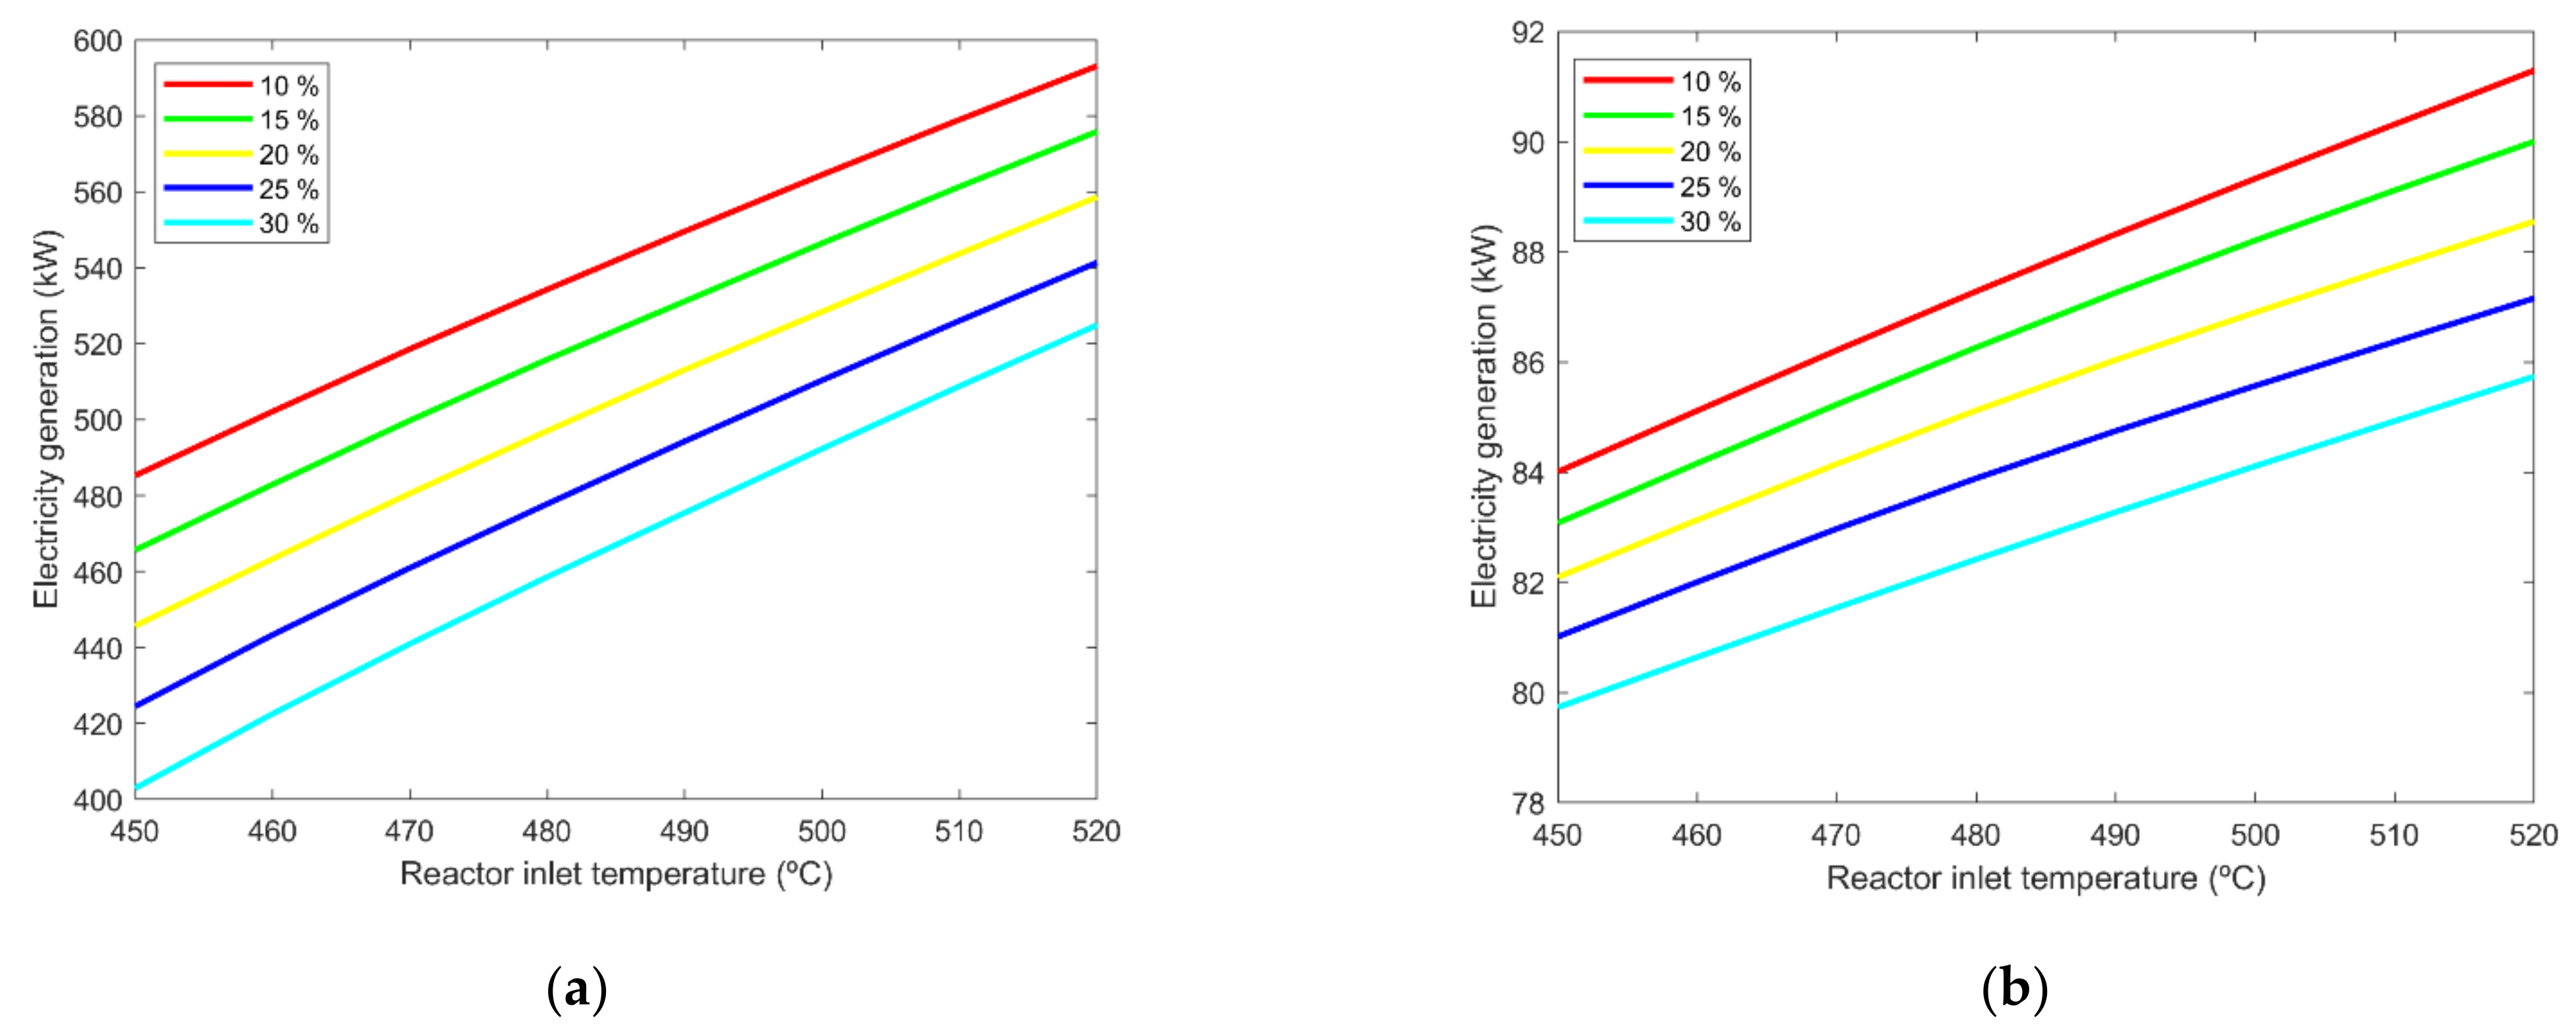
Figure 13a shows the electricity generation in the GT for the operating conditions. In the same way, to quantify the available energy in the hot effluent leaving the reactor, a cycle yield of 12% [
55] is considered for the exchange of thermal power.
Figure 13b exhibits the electricity generation for different operating conditions of the plant.
As can be seen in these figures, the results obtained show the same trends previously explained for case study A, increasing the electricity generation when the plant operates at low glycerol concentrations in the feed stream. Thus, data obtained from
Figure 13 show that the plant with GT could produce total electrical power in the range from 482 to684 kW. By evaluating the electrical efficiency as previously described in case study A (but considering electricity generated in the GT instead of the ICE), the values obtained are exposed in
Table 5. These results are obtained when the reactor inlet temperature is 520 °C.
As previously mentioned in case study A, syngas (mainly H2, CH4, and CO) generation can be referenced to the base scenario but moving the operating temperature range to those considered here (established by the temperature of the exhaust GT gases).
Although the proposed process configurations do not allow the operation of the plant without external energy supply, there are other alternative technologies that can satisfy the demand for energy. In this way, future research directions are proposed in the next section as new case studies to be analyzed in forthcoming works.
3.4. Future Research Directions
One feasible alternative to be analyzed consists of using the hot effluent from the reactor for the stream preheating in a first preheater and the utilization of the available energy in the exhaust gases coming from ICE and GT in a second preheater. In this plant scheme, an external fuel supply is required. In this configuration, there is a reduction in the exhaust gas flowrate from ICE/GT when compared with cases A and B, which also decreases the size of the engines and, therefore, the capital cost of the plant. A rough estimate gives a power reduction of approximately 70%.
Another option is hybridization with solar thermal energy, thus, considering energy storage, by heating a heat transfer fluid (HTF) by means of cylindrical-parabolic solar concentrators. This HTF (for example, Therminol) can be heated to 400 °C without degradation and would be suitable for the first preheating in the SCWG process. With this solution, there would be an important reduction in fuel consumption, thus, maximizing the overall efficiency of the entire plant. Additionally, the storage of thermal energy (STE) by molten salts would allow a continuous mode of operation in the plant 24 h per day. However, the maximum allowable temperature of Therminol can affect the conversion of organic waste and an additional heat source is necessary to achieve at least 500 °C at the reactor inlet, thus, increasing conversion. For this purpose, three different methods can be conceived using:
− the energy available in the exhaust gases coming from ICE and GT in a second preheater;
− thermal energy from the output of the reactor in a second preheater, or;
− an autothermal reforming (ATR) process, involving a partial oxidation along with the gasification reactor inlet (SCWG). In this way, enough oxygen/air should be entered the preheater outlet to achieve the set point temperature (~500 °C). This solution would reduce the produced syngas as a fraction of the organic waste that is oxidized.
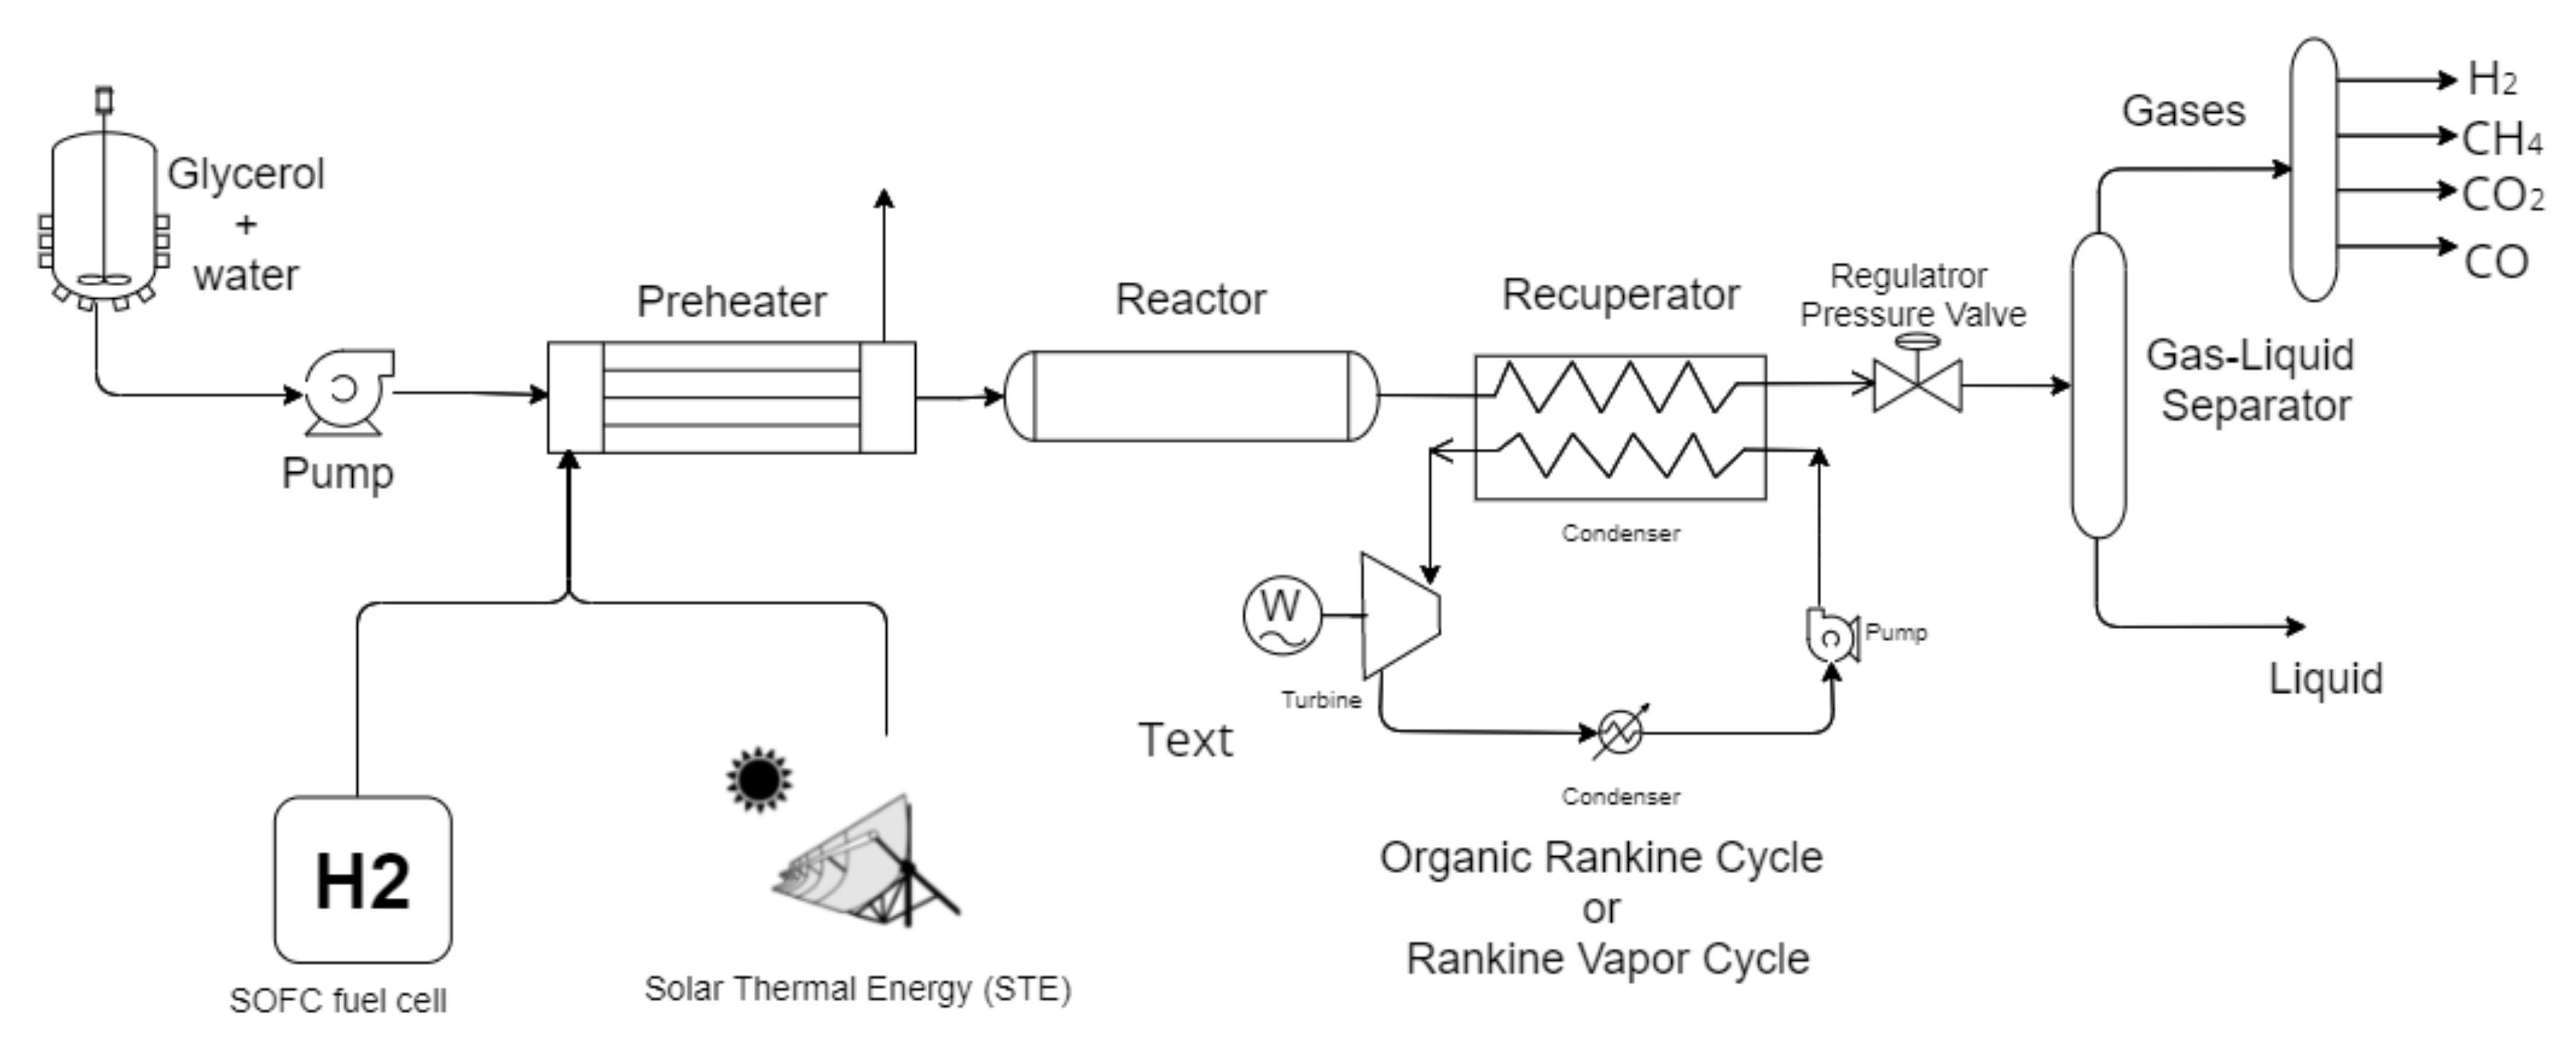
One more feasible alternative is the hybridization with an SOFC-type fuel cell, in which electric power is generated by feeding with two streams, one is air and the other is H
2 (or light hydrocarbons), which could come from the SCWG process itself. H
2 is recirculated and the exhaust is a stream of steam and air (or gas, if hydrocarbons are used) between 900 and 1000 °C, allowing the SOFC fuel cell to hybridize with the SCWG process. In addition, the temperature of the SOFC exhaust stream will be higher than 500 °C at the exit of the exchange with the reactor, therefore, it can be used for the preheating section, thus, integrating both sections.
Figure 14 shows a scheme of the plant with the fuel cell or the STE.
4. Conclusions
Supercritical water gasification is a promising technology for syngas generation from wet waste biomass. Several pilot scale plants have been built around the world to gain experience in the valorization of a wide range of feedstocks. However, commercialization and implementation at the industrial level are not fully developed because of the various drawbacks that result from investment and process operation, among other factors. To explore possible alternatives aimed at taking advantage of synergies with other processes; this work suggests the use of combined heat and power technologies as means to improve energy efficiency.
The proposed analysis addresses the hybridization of SCWG plants with ICEs (internal combustion engines) and/or GTs (gas turbines). By integrating these technological solutions for the energy supply in an SCWG plant, the feed stream can be heated using exhaust gases, and electricity is generated at the same time. Additionally, a syngas stream is produced, thus, performing the valorization of a waste feedstock.
To embrace the possible process configurations, two different case studies have been carried out from a base scenario, to hybridize the process with ICE and GT, respectively, but using external fuel for feeding in both cases. The electrical power generated with the ICE solution is in the range from 1611 to 2381 kW, allowing the injection of power into the electrical grid. Similar efficiency is achieved with the GT solution, although in this case with an important reduction in mechanical power with respect to the ICE solution and, thus, with a lower electrical power generation ranging from 482 to 684 kW. In both cases, there is a stream of syngas (mainly H2, CH4, and CO) that can be used in other applications. The results obtained in the case studies analyzed, both energy recovery from exhaust gases and electricity generation, might be promising to improve energy use and consumption, but this requires further research. In fact, the two configurations studied in their present level of development involve a high external fuel flowrate, which is even higher than the syngas flowrate generated in the SCWG reactor; therefore, they should be disregarded for direct installation as studied for a new fully SCWG plant. However, it might make sense to implant an SCWG process in an existing plant, such as a sewage station where the needed electrical power may be supplied by ICEs or GTs to which could be added an SCWG process, i.e., when there are ICEs and/or GTs installed in a specific plant, an SCWG process could be integrated into it. Thus, this application might have sense in any power plant or subsystem in an existing plant where electricity was obtained from ICEs or GTs. Naturally, further optimization and hybridization studies including other technologies may reverse this preliminary conclusion, making the use of ICE and/or GT techno-economically feasible.
As alternatives or supplements, new process configurations (with a partial external fuel supply) and the use of complementary technologies, such as autothermal SCWG, solar thermal energy with storage, or an SOFC-type fuel cell, open new research directions for future work.


