Fine structure of the lunar crust and upper mantle in the mare serenitatis derived from gravity multi-scale analysis
 Hangtao Yu
 Chuang Xu
 Yihao Wu
 Jinbo Li
 Guangyu Jian
 Ming Xu
- 1Guangzhou Marine Geological Survey, China Geological Survey, Guangzhou, China
- 2Key Laboratory of Marine Mineral Resoures, Ministry of Natural Resources, Guangzhou Marine Geological Survey, China Geological Survey, Guangzhou, China
- 3National Engineering Research Center for Gas Hydrate Exploration and Development, Guangzhou, China
- 4Department of Geodesy and Geomatics Engineering, Guangdong University of Technology, Guangzhou, China
- 5School of Earth Sciences and Engineering, Hohai University, Nanjing, China
It is significant for revealing the formation mechanism of the lunar Mascon to invert the refined 3-D lunar crust and upper mantle structure of the Mare Serenitatis. As the development of space exploration technology, lunar gravity data has advantages of high accuracy and resolution, which can be used to invert the lunar crust and upper mantle structure. However, gravity anomaly reflects all anomalous material during the whole Moon’s interior, and its vertical structure recognition capability is poor. Thus, this paper adopts wavelet multi-scale analysis method to decompose the gravity anomaly in the Mare Serenitatis for enhancing vertical resolution, and the corresponding field source depths of the decomposed gravity anomalies are further estimated by power spectrum method. Subsequently, the layered densities and the crust-mantle interface depth of the Mare Serenitatis are inverted. The research results show that the 3-D morphological character of two large high-density materials in the Mare Serenitatis is clearly depicted. The southwest high-density material with its bottom center at approximately (15°E, 25°N) has the depth range of 50 km–80 km and the maximum diameter of approximately 150 km. As for the southeast high-density material, its bottom center is located at approximately (23°E, 25°N), the depth range is 30 km–60 km and the maximum diameter is approximately 100 km. Another new finding is that the crust-mantle interface uplift has obviously fallen back in the center of the Mare Serenitatis. The high-density materials and crust-mantle interface uplift may together promote the formation of the Mascon in the Mare Serenitatis.
Key points
• A refined 3-D structure model of the lunar crust and upper mantle in the Mare Serenitatis was constructed.
• The 3-D morphological feature of two high-density materials beneath the study area was revealed.
• A falling phenomenon for the crust-mantle interface uplift is found in the center of the Mare Serenitatis basin.
1 Introduction
The Mare Serenitatis is one of the largest lunar mares on the Moon, with a ring structure of approximately 880 km in diameter and the area of approximately 310,000 km2 (Solomon and Head, 1979; Watters and Konopliv, 2001). It is bordered by the western Mare Imbrium, the southeastern Mare Tranquillitatis, the northern Mare Frigoris, the northeastern Lacus Somniorum (LS) and Posidonius (PO), and the southwestern Mare Vaporum (Hiesinger et al., 2000). The Mare Serenitatis Basin is surrounded by numerous mountains, such as the Montes Caucasus (MC) in the northwest, the Mons Hadley (MHL) in the west, and the Montes Haemus (MH) in the southwest (see Figure 1). Besides, the main lunar ridges on the Mare Serenitatis surface are DA, DVC, DG, DS, SR, DO, and DAD, which form an inner ring and an outer ring (Maxwell et al., 1975). These two rings have a clear trend of northward extension and a discontinuous distribution within the Mare Serenitatis Basin, which are often considered as the surface feature of folding and retrograde faults (Maxwell et al., 1975; Plescia and Golombek, 1986; Watters, 1988; Watters and Konopliv, 2001). In addition, as a result of multiple meteorite impact events, the surface of the Mare Serenitatis is dotted with impact craters. Bessel (BE) is the largest one and the eastern basin margin is covered by a 60 km diameter impact crater, Le Monnier Crater (LM) (Pieters, 1978).
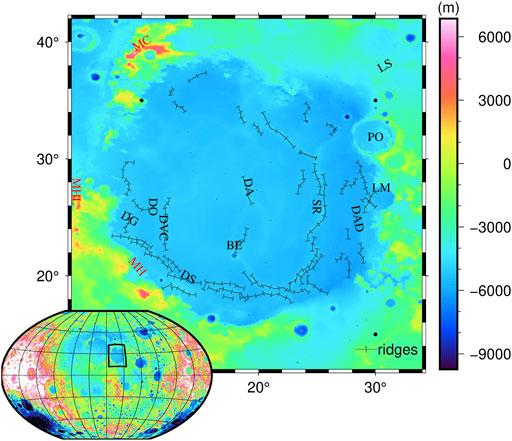
FIGURE 1. Topography of the Mare Serenitatis. MC, montes caucasus: MHL, mons hadley; MH, montes haemus; DA, dorsum azara; DVC, dorsum von cotta; DG, dorsum gast; DS, dorsa sorby; SR, serpentine ridge; DO, dorsum owen; DAD, dorsa aldrovandi; BE, bessel; LM, le monnier crater; LS, somniorum; PO, posidonius. The black lines with bars represent lunar ridges.
Up to now, the formation of the Mare Serenitatis is still controversial. Some scholars believe that it is a young basin type according to the Apollo 17 collection (Staudacher et al., 1978). However, the current prevailing view is that it has formed during the Nectarian Period (Wilhelms et al., 1987). Approximately 3.8 Ga ago, the Mare Serenitatis experienced an impact event from a minor celestial body and then it was filled with magma, gradually forming a special basalt-covered landscape with an average basalt thickness of 798 m (Li et al., 2018) and the main composition of low-titanium basalts (Kodama and Yamaguchi, 2003). Watters and Konopliv (2001) agreed that the Mare Serenitatis consisted of two overlapping basins (the northern basin is older than the southern basin), and suggested that the ring system of the Imbrium Basin had contributed to the topography of the Mare Serenitatis Basin, driving the terrain uplift of the western part of the Mare Serenitatis. Sharpton and James, 1982 showed that various areas of the Mare Serenitatis Basin were formed by the volcanic infilling and tectonic movements at different times. Therefore, it is of great importance to determine the refined lunar crust and upper mantle structure for understanding the formation mechanism and dynamical processes of the Mare Serenitatis (Watters and Konopliv, 2001).
During recent decades, numerous scholars have studied the surface morphological character of the Mare Serenitatis (Maxwell et al., 1975; Head, 1979; Sharpton and James, 1982; Ryder et al., 1997; Kaur et al., 2013; Li et al., 2018). However, the lunar crustal and upper mantle structure of the Mare Serenitatis is still inadequate at present. With the development of space exploration technology, lunar gravity data has its advantages of high accuracy and resolution, and can directly reflect the density distribution of the Moon’s interior. Thus, new progress is continuously made during the inversion of the lunar interior structure using gravity methods. Watters and Konopliv (2001) used gravity data from lunar prospectors to argue that the Mare Serenitatis contained two overlapping basins. Hikida and Wieczorek (2007) analytically calculated the external gravitational field of an arbitrarily shaped polyhedron to obtain the thickness of the whole lunar crust. Wieczorek et al. (2013) used the Gravity Recovery and Interior Laboratory (GRAIL) gravity data and the Lunar Reconnaissance Orbiter (LRO) topographic data to yield models of lunar crustal thickness under different conditions. Liang et al. (2014) used a new inversion algorithm to obtain the 3-D density distribution of the lunar crust and mantle, and found large areas of lateral density heterogeneity beneath the South Pole-Aitken Basin. Zhao et al. (2021) obtained the 3-D density structure of the lunar crust and upper mantle based on the lunar gravity field model GL1500E. However, gravity data is the comprehensive reflection for the density and volume of all materials in the lunar interior, which makes it difficult to obtain accurate density structures at different depths. Hence, it is urgent to develop more effective methods for improving the vertical identification capacity of gravity data.
At present, the methods, commonly used for separating gravity signals to enhance vertical identification capacity of subsurface structure, include trend analysis, analytic extension, wavelet multi-scale analysis, and so on. Among them, wavelet multi-scale analysis is one of the most effective methods, which can accurately extract the gravity signals corresponding to target bodies at different depths. It has been proven and widely used in the study of the Earth’s crustal and upper mantle structure (Jiang et al., 2012; Xu et al., 2017; 2018). Therefore, this paper firstly adopts wavelet multi-scale analysis to decompose the Bouguer gravity anomaly in the Mare Serenitatis. And then the subsurface density structure at different depths and the crust-mantle interface relief are inverted. Lastly, the tectonic implications of the new obtained 3-D lunar crustal and upper mantle structure beneath the study area are discussed.
2 Data and methods
2.1 Data
The adopted gravity data in this paper are derived from the GRGM1200A spherical harmonic coefficient model from National Aeronautics and Space Administration (NASA)’s GRAIL satellite (Lemoine et al., 2014; Goossens et al., 2016), which is a corrected Bouguer gravity field model with the degree of 1200 and covers the entire Moon.
2.2 Bouguer gravity anomaly calculation
The Bouguer gravity anomaly
where
2.3 Multi-scale decomposition of Bouguer gravity anomaly
According to the principle of wavelet multi-scale analysis (Mallat, 1989),
where
Gravity anomalies in various frequency bands can be regarded as the signals of anomalous materials at different depths. The average field source depth
where
2.4 Layered density inversion
According to the mean field source depth
where
where
where
where
2.5 Crust-mantle interface depth determination
It is a key factor for obtaining refined crust-mantle interface depth to accurately extract the gravity anomaly signal caused by the crust-mantle interface relief, which needs to remove the effect of sediments, consolidated crystalline lunar crust and lower lunar mantle (Wan et al., 2019). The common methods for these corrections depend on existing lunar crustal and mantle models. However, at present the lunar crustal and mantle models are not accurate, which may cause large errors during the corrections. Hence, in this paper the gravity anomaly signal
Subsequently, the crust-mantle interface depth
where
in which
2.6 Profile density inversion
Because the vertical density variation of the layered density inversion is not continuous, the profile density inversion is further conducted in order to recover a more refined 3-D structure of the lunar crust and upper mantle in the Mare Serenitatis region. The compact gravity inversion method proposed by Last and Kubik (1983) is adopted to construct the profile density model in this paper. The profile gravity anomaly
where
Among them, the parameters are:
where
where
where
3 Results and analysis
3.1 Bouguer gravity anomaly in the mare serenitatis
Figure 2 shows the Bouguer gravity anomaly at the elevation of 0 km with the spatial resolution of
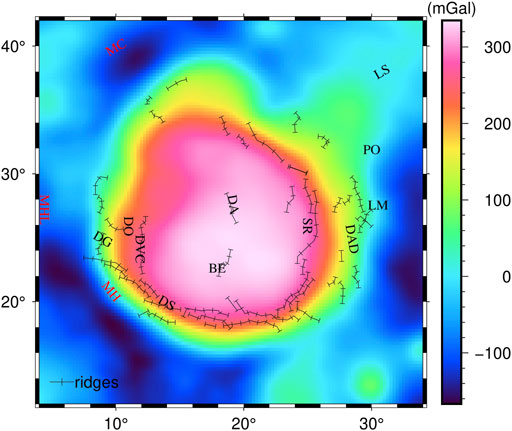
FIGURE 2. Bouguer gravity anomaly of the mare serenitatis.
In Figure 2, the Bouguer gravity anomalies range from −186 mGal to 336 mGal. Compared to the surrounding area, the gravity anomaly of the Mare Serenitatis Basin (9°E–29°E and 17°N–36°N) is positive and high, which is pear-shaped. The gravity anomaly is the highest in the center of the Mare Serenitatis Basin and gradually decreases in all directions, showing a clear Mascon character. In addition, there is a negative correlation between the Bouguer gravity anomaly and the topography (Figure 1). The gravity anomaly highs in the center of the Mare Serenitatis correspond to lowlands with the elevation of approximately −5 km. However, the gravity anomaly lows are consistent with the mountains, such as the MC, the MHL and the MH. Moreover, the ridges are primarily located at the gravity high-low transitional zones, such as the DG, the DS and the SR.
3.2 Decomposed Bouguer gravity anomaly
The Bouguer gravity anomaly is the comprehensive reflection of all subsurface anomalous materials. It cannot directly reflect the distribution of the material at different depths. Thus, the Bouguer gravity anomaly is further separated by wavelet multi-scale method. According to the previous research on the selection of the optimal wavelet basis (Xu et al., 2017), this paper adopts the “coif3” wavelet basis and performs a 2D wavelet decomposition for the Bouguer gravity anomaly of the Mare Serenitatis using Eq. 2. The decomposed results are shown in Figure 3, and their mean field source depths estimated by Eq. 3 are shown in Figure 4 and Table 1. In the subplots of Figure 3, D1–D8 represent the order one to eight wavelet details, respectively. The subplots in Fig. 4 are the corresponding radial logarithmic power spectrum of wavelet detail D1–D8, respectively.
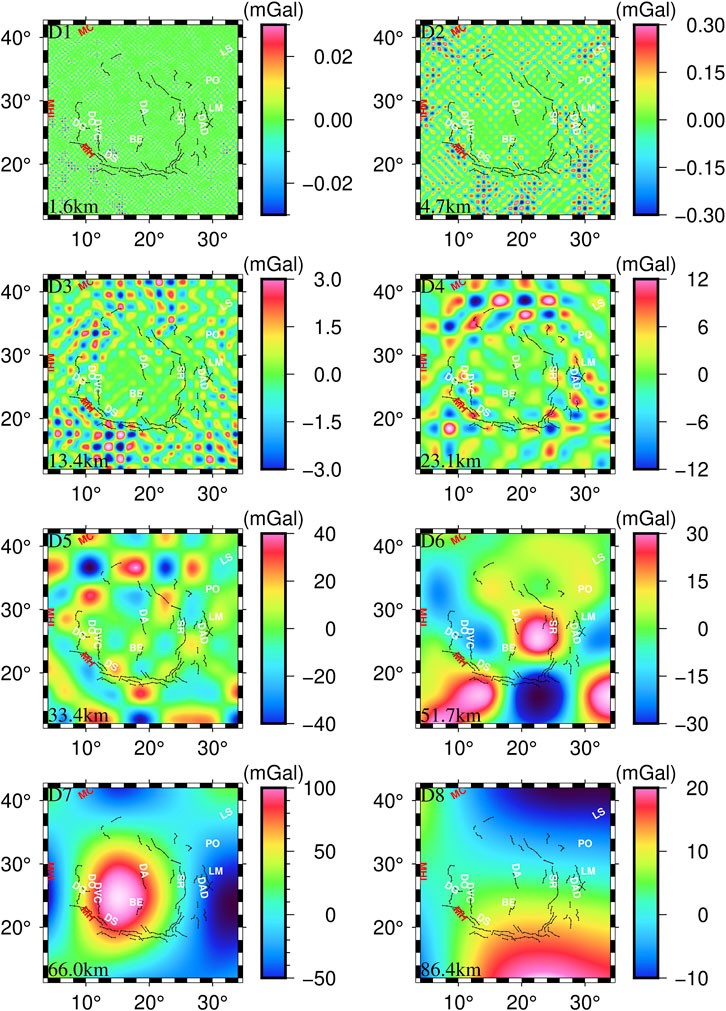
FIGURE 3. Decomposed gravity anomalies D1–D8 in the Mare Serenitatis, whose mean field source depths estimated by Eq. 3 have marked on the left bottom of each figure.
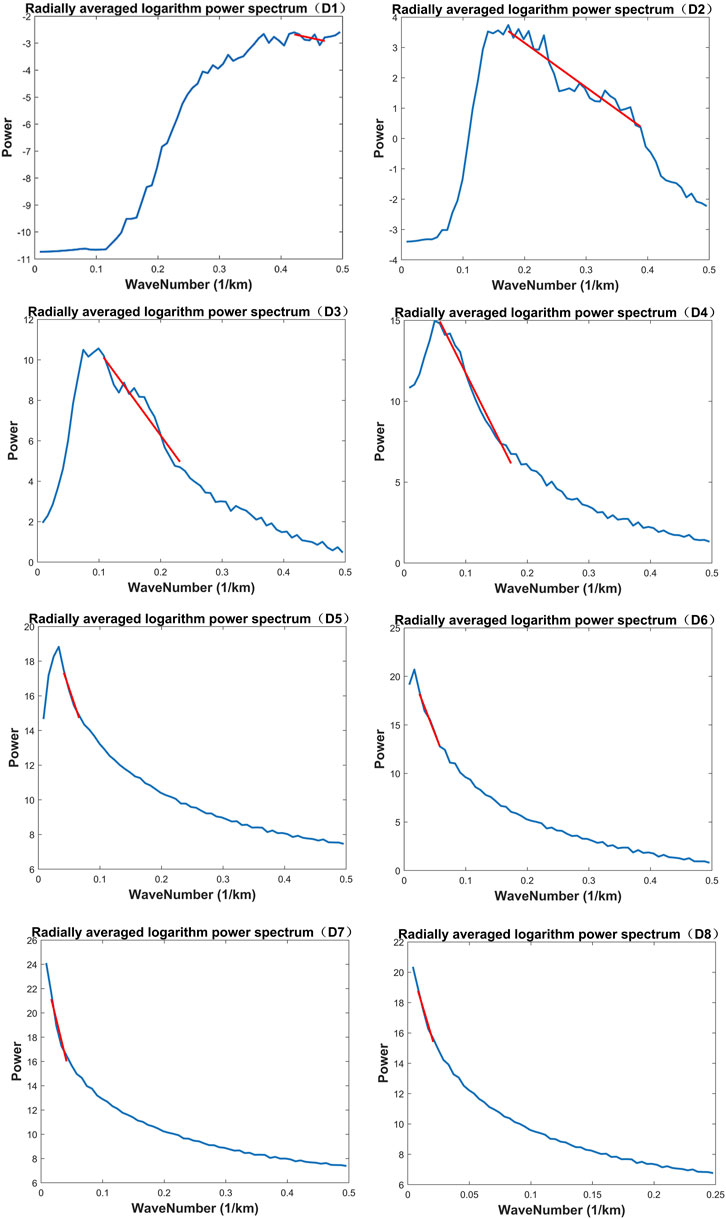
FIGURE 4. Radial logarithm power spectrum of the decomposed gravity anomalies D1—D8 in the Mare Serenitatis. The estimated mean field source depths of D1—D8 are shown in Table 1 and on the left bottom of each corresponding figure in Figure 3.
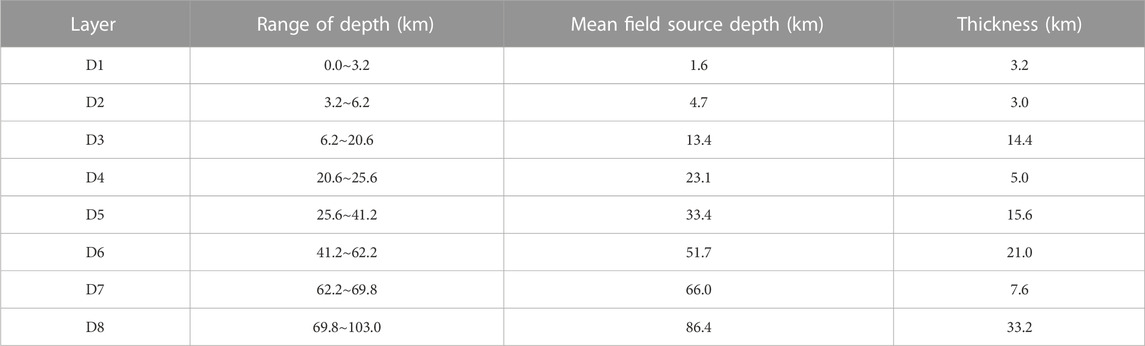
TABLE 1. The layered model in the mare serenitatis.
According to Figure 3, the gravity anomalies in D1 are very weak and may be interference signals. The gravity anomaly values of D2 vary slightly from −0.3 mGal to 0.3 mGal, whose average source depth is approximately 4.7 km corresponding to the distribution of shallow sediments. Gravity anomaly values of D3 with the average source depth of 13.4 km range from −3.0 mGal to 3.0 mGal. Small positive and negative alternating gravity anomaly circles are beginning to appear, obviously in the south of DS. The average source depth of D4 is approximately 23.1 km and the gravity anomaly values range from −12.0 mGal to 12.0 mGal. The gravity anomaly circles are further expanded, which are mainly distributed along the outer ring of the Mare Serenitatis, such as DO, DS and DAD. It indicates that tectonic structure begins to become complex. In addition, there are apparent gravity anomaly signals during 15°E–25°E and 35°N–42°N, which is highly consistent with the location of the center of the “D ridge system” mentioned by Maxwell et al. (1975). This could be the signals of anomalous material left over from the meteorite event that formed the “D ridge system”. Based on the lunar crust thickness model of Wieczorek et al. (2013), the mean source depth of D4 should be roughly at the interface between the lunar crust and mantle in the Mare Serenitatis region. The gravity anomaly values of D5 with the average source depth of 33.4 km range from −40 mGal to 40 mGal. The gravity anomaly circles are larger. The mean source depth of D6, with gravity anomaly values ranging from −30 mGal to 30 mGal, is approximately 51.7 km. During the 20°E–27°E and 23°N–30°N corresponding to the inner ring region between DA and SR (Maxwell et al., 1975), there is the first large anomaly in the Mare Serenitatis Basin. The center of this large anomaly is at approximately 23°E and 25°N. The D7 shows the distribution of gravity anomalies with the average source depth of 66 km. The values range from −50 mGal to 100 mGal, which is the largest variation ranges for D1–D8. There is another obvious gravity anomaly high, the second large anomaly, whose center is located at 15°E and 25°N. Compared with the first large anomaly mentioned in D6, the second large anomaly in this area is stronger, deeper and more widespread. Therefore, this paper agrees with Watters and Konopliv (2001) that the Mare Serenitatis consists of two overlapping basins. The western basin corresponds to a larger impact forming the outer ring and the eastern basin is in agreement with the inner ring structure of the Mare Serenitatis Basin. The mean source depth of D8 is approximately 86.4 km and the gravity anomaly values range from −10 mGal to 20 mGal. It can be seen that there are no longer any obvious gravity anomaly circles, and the anomaly signals gradually weaken and disappear. It indicates that the tectonic structure at this depth tends to be stable.
According to above analysis, D1–D3 primarily reflects the gravity anomaly distribution of the lunar crust in the Mare Serenitatis area. With depth increasing, the gravity anomaly circles and magnitude gradually become larger. D4—D5 show obvious positive-negative alternating gravity anomalies, indicating the complex tectonic structure. D6—D7 present the morphological characteristics of the two large gravity anomaly highs in the southeast and southwest, which are presumed to be closely related to the inner and outer ring structure of the Mare Serenitatis. D8 indicates that there are no more obvious anomalies at the depth of 86.4 km.
3.3 Inverted layered density results
Firstly, the lunar crust and upper mantle of the Mare Serenitatis is layered according to the corresponding mean field source depths of the decomposed Bouguer gravity anomalies, see Table 1. Then, each layer is gridded and modelled using Tesseroids and the size of each Tesseroid is
The results of D1 and D2 are not presented in Figure 5 because of their small density fluctuations. D3 presents the density distribution at the depth of 13.4 km underneath the Mare Serenitatis. The density values range from 2.88 g/cm3 to 2.92 g/cm3. The circles of density highs and lows begin to appear mainly around the Mare Serenitatis basin. D4 corresponds to the density distribution at the depth of 23.1 km, which is approximately at the interface between the lunar crust and mantle in the Mare Serenitatis Basin. The values of density distribution range from 2.90 g/cm3 to 3.10 g/cm3. Compared with D3, the circles of density highs and lows become larger. It is noteworthy that in the 15°E–25°E and 35°N–42°N (the center of the aforementioned “D ridge system”), there are several obvious density high circles, which are presumed to be meteorite impact residue. Besides, there is a small high-density circle at (30°E, 27°N), which may be caused by the meteorite impact corresponding to LS in Figure 1. It indicates that meteorite impacts may induce density heterogeneity, which has been also discussed by Kierfer et al. (2012). The density distribution of D5 reflects the materials at the depth of 33.4 km. The high-density areas are discrete, implying the complex tectonic structure. The D6 corresponds to the density distribution at the depth of 51.7 km beneath the Mare Serenitatis. There is an obvious high density at (23°E, 25°N), which may be the result of a meteorite impact event forming the inner ring structure. D7 corresponds to the density distribution at the depth of 66 km. The whole Mare S. basin is nearly covered by a high-density material, whose center is at (15°E, 25°N). This is the second high density circles within the Mare Serenitatis, and it is presumed to be closely related to the outer ring structure of the Mare Serenitatis. The density distribution of D8 with the depth of 86.4 km has become smooth, indicating that the tectonic structure is beginning to stabilize.
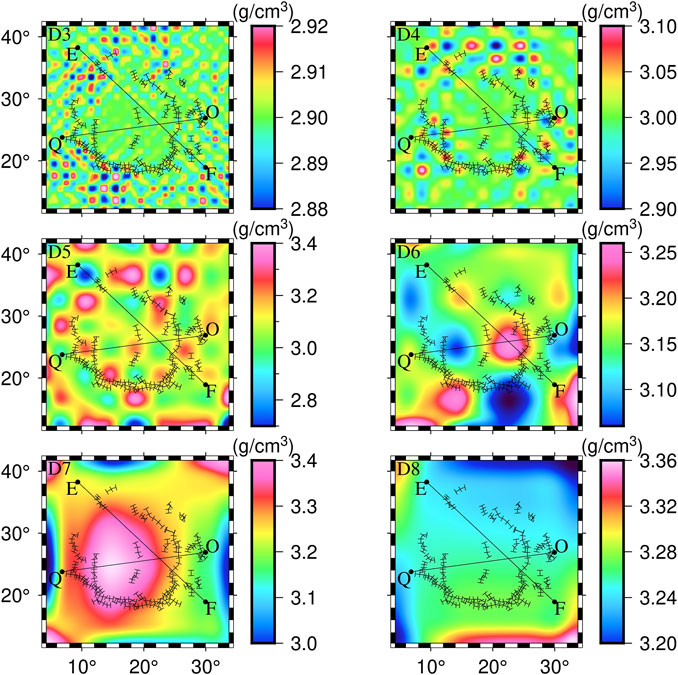
FIGURE 5. Results of the layered density inversion in the Mare Serenitatis. E-F and O-Q are the location of profile density inversion.
In summary, there are two high-density bodies with different locations, depths and sizes in the Mare Serenitatis Basin. The center and mean depth of the southeastern high-density body is (23°E, 25°N) and 51.7 km, respectively. The southwestern one is centered at (15°E, 25°N) and has the mean depth of 66 km. These two high-density materials are presumed to be closely related to the inner and outer ring structure of the Mare Serenitatis (Maxwell et al., 1975; Watters and Konopliv, 2001).
3.4 Determined crust-mantle interface depth
According to the a priori information (Hikida and Wieczorek, 2007; Wieczorek et al., 2013), it is known that the average crust-mantle interface depth in the Mare Serenitatis region is approximately 25 km, which is close to the average field source depth of D4 in Figure 3. Thus, the 4th-order wavelet approximation A4 (see Figure 6) of the Bouguer gravity anomaly is regarded as the signal of crust-mantle interface relief, and then the crust-mantle interface depth of the Mare S. region is determined by the iterative inversion of Eq. 11, where the average depth and density contrast of crust-mantle interface are set as 25 km and 0.56 g/cm3, respectively (Hikida and Wieczorek, 2007; Wieczorek et al., 2013). Figure 7 shows the determined crust-mantle interface depth underneath the Mare Serenitatis.
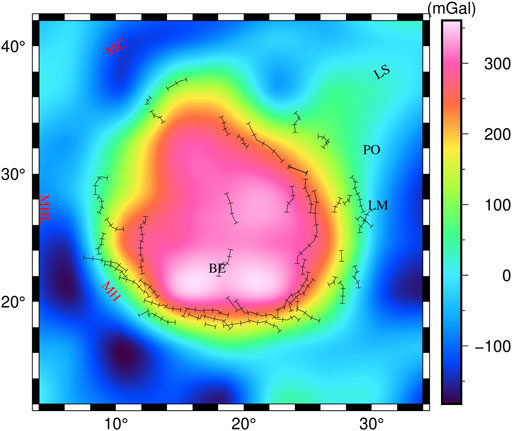
FIGURE 6. The 4th-order wavelet approximation A4 of the Bouguer gravity anomaly.
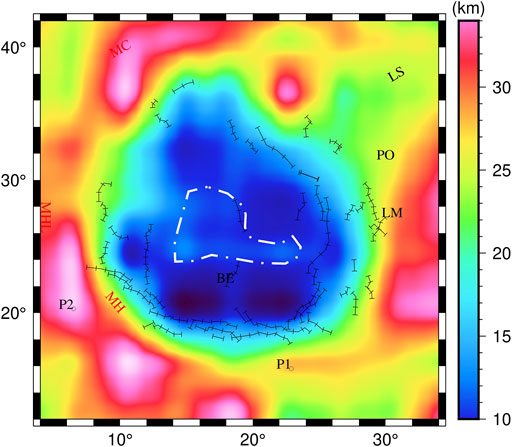
FIGURE 7. Inverted crust-mantle interface depth beneath the Mare Serenitatis. The white dashed lines represent the inferred falling area of the crust-mantle interface uplift. P1 and P2 are the locations of lunar seismic inversion from Chenet et al. (2006).
On the whole, the crust-mantle interface depth gradually shallows from the outside to the inside of the Mare Serenitatis, see Figure 7. The depth in MC, MHL and MH is approximately 35 km, and that in LS, PO and LM is between 20 and 26 km. The depths of the marginal area (green part in Figure 7) of the Mare Serenitatis are approximately 22 km. Further, the light blue area has the average depth of approximately 15 km, and the dark blue area has the average depth of about 10 km. The shallowest depth, located at the south of the Mare Serenitatis Basin (east and west of BE), is only approximately 4 km, whose positions are correspondence with the two high-density materials aforementioned.
According to above analysis, the crust-mantle interface of the Mare Serenitatis is obviously uplifted, which is in good agreement with the result of Wieczorek et al. (2013). The reason may be the post-impact rebound after a large meteorite impact event, which generated thermal energy perturbation leading to lateral temperature differences in the lunar mantle, followed by the rapid and uniform uplift of the mantle (Wieczorek and Phillips, 1999; Chen et al., 2009). In addition, there is a new finding that the uplift of crust-mantle interface falls back in the center of the Mare Serenitatis, see the white dashed lines in Figure 7. The deepest depth surrounded by the white dashed lines is approximately 17 km, which is deeper than the depth of the dark blue area. It suggests that the uplift of the crust-mantle interface is irregular. Combined with the results of layered density inversion (Figure 5), it further demonstrates that the Mascon in the Mare Serenitatis area may be formed by the combination effect of the high-density materials and crust-mantle interface uplift.
Further, we extracted the lunar seismic inversion results of P1and P2 (Figure 7) from Chenet et al. (2006) and compared them with the crust-mantle interface depth in this study, as shown in Table 2. The difference of crust-mantle interface depths between Chenet et al. (2006) and this study is 0.1 km at P1 and 3.75 km at P2, respectively. The inverted crust-mantle interface depths in this study are in agreement with those provided by Chenet et al. (2006), which verifies the correctness of our results.
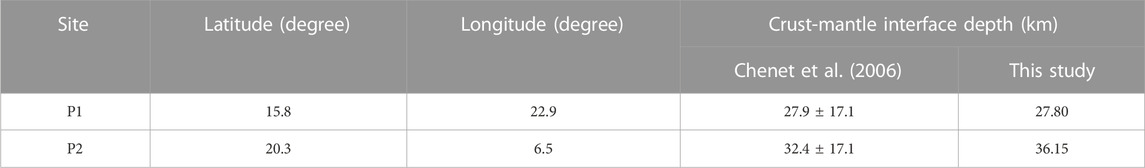
TABLE 2. Crust-mantle interface depth comparison from various researches in the mare serenitatis.
3.5 Inverted profile density
Firstly, a simple synthetic test is designed to verify the correctness of the compact gravity inversion method proposed by Last and Kubik (1983), which will be applied to invert the profile density of the lunar crust and upper mantle in the Mare Serenitatis. In the synthetic test, we set up several modules with different shapes and depths, as shown in the lower subplot of Figure 8, where each module (deep red areas) has a relative density value of 0.3 g/cm3 and other areas (white regions) have a relative density value of 0 g/cm3. Based on this model, we calculate the gravity anomaly (Gmodel), as shown at the upper subplot (red line) of Figure 8. Then, this calculated gravity anomaly is considered as input (Gobs in the upper subplot of Figure 9), and the compact gravity inversion method is employed to inverted the profile density. The inverted results using Eq. 23 are shown in the lower subplot of Figure 9. The inverted density distribution in Figure 9 is in good agreement with the original model of Figure 8, which demonstrates that the primary density anomalous bodies can be recovered effectively by the compact gravity inversion method. In addition, the RMS of the difference between Gmodel and Gobs is 0.0004 mGal. Thus, it indicates that the compact gravity inversion method is correct according to the synthetic results. It is also worth noting that there are some differences between the lower subplot of Figures 8, 9, such as the light blue areas in Figure 9. The reason may be that the shape of synthetic modules in Figure 8 is regular and the values of density setting are not continued, which may cause signal leakage and distortion during the inversion.
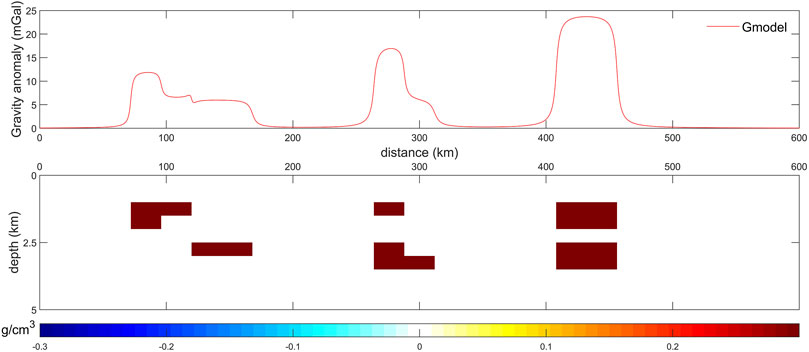
FIGURE 8. Synthetic model and forward gravity anomaly. Gmodel: calculated gravity anomaly from the synthetic model.
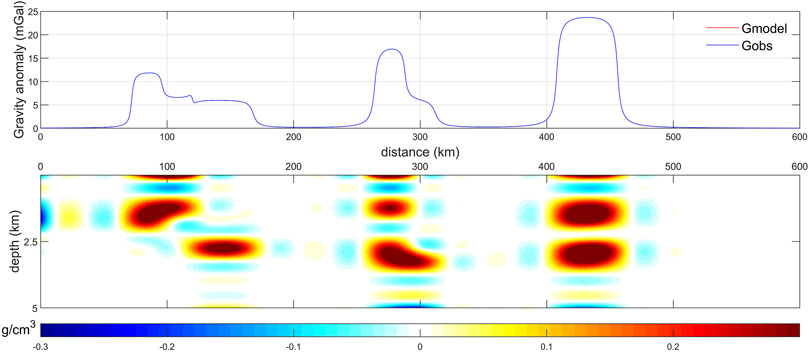
FIGURE 9. Inverted profile density distribution from the gravity anomaly. Gobs: inputted gravity anomaly.
Subsequently, the compact gravity inversion method is used to invert the density distribution of two intersecting profiles, E-F and Q-O (as shown in Figure 5), in order to further reveal the detailed morphological characteristics of two high-density materials in the Mare Serenitatis. E-F and Q-O just go through the centers of two high-density materials, whose profile density anomalies (anomalies relative to the average surrounding density) are inverted as shown in Figures 10, 11. During the profile density inversion, the length and width of each cell module are set as 20 km and 5 km respectively, and the total depth of the inversion is 100 km (the density anomalies at deeper depths are no longer apparent). Two subplots are included in Figures 10, 11. The upper subplot shows the comparison between Gmodel and Gobs, and the RMS of the difference between Gmodel and Gobs for E-F and Q-O is 3.886 mGal and 2.4706 mGal, respectively. It indicates that the inverted profile density anomalies are reliable. The lower subplot shows the profile density anomaly distribution.
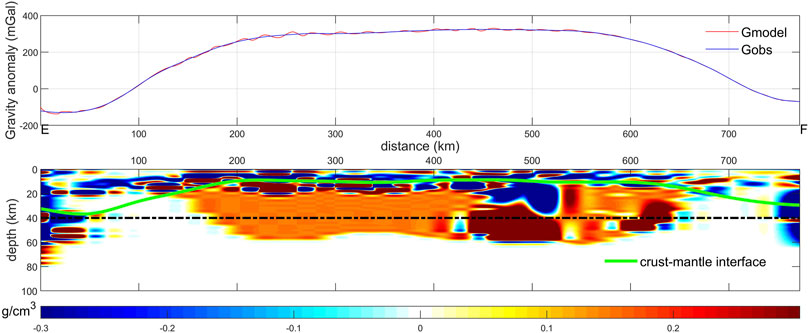
FIGURE 10. Inverted profile density anomaly distribution of E-F in the Mare Serenitatis. The green solid line is the lunar crust-mantle interface. The black dashed line represents the depth of 40 km, which is for assistant analysis.
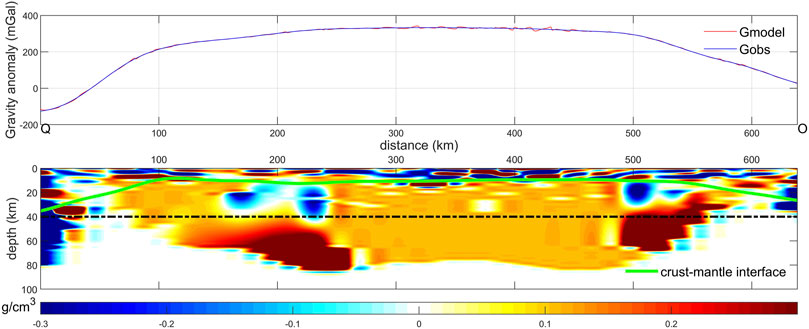
FIGURE 11. Inverted profile density anomaly distribution of Q-O in the Mare Serenitatis.
In Figure 10, there is an obvious large-scale high-density anomalous material, which is located at the distance of 430 km–530 km from Point E with the depth of 30 km–60 km. It is the first high-density anomalous body mentioned in the Figure 5. In Figure 11, there are two obvious larger-scale high-density anomalous materials. The left one is located at 110 km–260 km from Point Q with the depth of 50 km–80 km, which is the second high-density anomalous body mentioned in the Figure 5. The right one is consistent with the first high-density anomalous body presented in Figure 10. In addition, the falling phenomenon of the lunar crust-mantle interface uplift in the center Mare Serenitatis can be observed clearly both in the Figures 10, 11. Above the two high-density anomalous materials, there are apparent low-density materials, which may be formed by the filled magma after meteorite impacts.
Lastly, we compare the inverted profile density (Figures 10, 11) with the results of the same profiles from the inverted layered density (Figure 5) as shown in Figure 12 and Figure 13. Comparing the results in Figures 10, 12, the locations of the first high-density anomalous body are similar, which are both at the distance of approximately 500 km from Point E with the depth of approximately 50 km. Above the first high-density anomalous body, there are both low-density materials in Figures 10, 12. Comparing the results in Figures 11, 13, the locations of the second high-density anomalous body are also consistent, which are both at approximately 200 km from Point Q with the depth of approximately 70 km. Above the second high-density anomalous body, there are also both low-density materials in Figures 11, 13. Thus, on the whole, the inverted profile density (Figures 10, 11) and the inverted layered density (Figures 12, 13) can match well at the large-scale features. However, there are also some apparent differences in details between the inverted profile density (Figures 10, 11) and the inverted layered density (Figures 12, 13). For example, there is an obvious low-density anomaly at the distance of 0–110 km from Point E with the depth of 25–40 km in Figure 12, while it is not existed in Figure 10. The reason may be that the adopted methods with the assumptions of the profile density inversion and layered density inversion are all different. According to above analysis, the inverted profile density and the inverted layered density can complement each other, which may provide more information for understanding the lunar crust and upper mantle structure in the Mare Serenitatis.
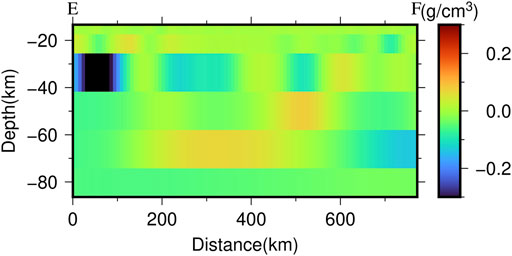
FIGURE 12. Profile density of E-F from the layered density inversion in Figure 5.
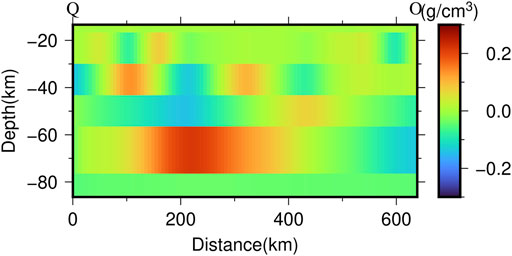
FIGURE 13. Profile density of Q-O from the layered density inversion in Figure 5.
4 Discussion
The layered density inversion and profile density inversion results reveal the existence of two high-density anomalous bodies with different locations and depths, which are highly related with the inner and outer ring structure of Mare Serenitatis. The first high-density anomalous body located in the southeast corner of the Mare Serenitatis Basin has an approximate depth range of 30 km–60 km and a maximum diameter of approximately 100 km, and its center is at roughly (23°E, 25°N). The second high-density anomalous body, located in the south-western corner of the Mare Serenitatis Basin with its center at approximately (15°E, 25°N), has an approximate depth range of 50 km–80 km and a maximum diameter of approximately 150 km. Liang et al. (2014) and Zhao et al. (2021) have suggested that the high-density anomalies in the interior of the Mare Serenitatis Basin are located at the depth range of 20–50 km. The difference is that we have revealed the 3-D morphological characteristics of the two high-density materials, including their central location and diameter, which have not been mentioned in the previous studies.
In addition, the depth of the crust-mantle interface reveals that there is obvious crust-mantle interface uplift in the interior of the Mare Serenitatis Basin, which is in agreement with the results of Wieczorek et al. (2013) and Hikida and Wieczorek (2007). The difference is that the results of this paper show that the trend of crust-mantle interface uplift within the basin is not smooth (the uplift in the center of the Mare Serenitatis Basin has fallen significantly back), and the most obvious crust-mantle interface uplift exists at the location of the two high-density anomalous bodies. In conjunction with this phenomenon, it is reasonable to suggest that there is a strong correlation between the high-density anomalies and the crust-mantle interface uplift.
Therefore, we propose a bold hypothesis that the Mare Serenitatis was hit by at least two major meteorite impacts. The first impact was more intense and greater, occurring mainly in the southwest corner of the Mare Serenitatis Basin, which largely contributed to the formation of the outer ring structure. The second impact occurred mainly in the southeast corner of the Mare Serenitatis Basin, which may contribute to the formation of the inner ring structure.
5 Conclusion
In this paper, gravity multi-scale analysis is applied to invert the layered density structure and determine the depth of the crust-mantle interface in the Mare Serenitatis region. Firstly, according to the decomposed Bouguer gravity anomalies and their corresponding field source depths, the distribution of gravity anomalies generated by material at different depths is various. Then, the results of the layered density inversion further reveal that the lunar upper crust in the Mare Serenitatis has some lateral density distribution inhomogeneity. It is further extended in the lunar middle and lower crust. The lunar lower crust to the upper mantle contains two high-density anomalous bodies. At 86.4 km depth, there is almost no lateral density variation. Subsequently, the results of the crust-mantle interface inversion show that the crust-mantle interface of the Mare Serenitatis Basin is significantly uplifted and the shallowest crust-mantle interface is around 4 km depth. Besides, there is an obvious falling phenomenon for the uplift in the center of the basin. Lastly, the density anomaly inversion results of the two profiles further present the characteristics of the vertical density anomaly variation. The combination of the layered density, the crust-mantle interface and the profile density anomaly results suggest that the formation of the Mascon in the Mare Serenitatis may be due to the combined effect of the internal high-density anomalous bodies and crust-mantle interface uplift.
Data availability statement
The original contributions presented in the study are included in the article/supplementary material, further inquiries can be directed to the corresponding author.
Author contributions
Conceptualization, CX; methodology, HY and CX; software, HY; validation, HY and JL; formal analysis, CX; investigation, GJ and MX; data curation, JL and HY; writing—original draft preparation, HY and CX; writing—review and editing, CX and YW; visualization, MX; supervision, CX; project administration, CX; funding acquisition, CX. All authors have read and agreed to the published version of the manuscript.
Funding
This study was supported by the National Natural Science Foundation of China (Grant nos. 91428205, 41974014, 42274004) and the Natural Science Foundation of Guangdong Province, China (Grant no. 2022A1515010396).
Conflict of interest
The authors declare that the research was conducted in the absence of any commercial or financial relationships that could be construed as a potential conflict of interest.
Publisher’s note
All claims expressed in this article are solely those of the authors and do not necessarily represent those of their affiliated organizations, or those of the publisher, the editors and the reviewers. Any product that may be evaluated in this article, or claim that may be made by its manufacturer, is not guaranteed or endorsed by the publisher.
References
Chen, C., Chen, B., Ping, J., Liang, Q., Huang, Q., Zhao, W., et al. (2009). The interpretation of gravity anomaly on lunar Apennines. Sci. China Ser. G Phys. Mech. Astronomy 52 (12), 1824–1832. doi:10.1007/s11433-009-0281-0
Chenet, H., Lognonné, P., Wieczorek, M., and Mizutani, H. (2006). Lateral variations of lunar crustal thickness from the Apollo seismic data set. Earth Planet. Sci. Lett. 243 (1-2), 1–14. doi:10.1016/j.epsl.2005.12.017
Goossens, S., Lemoine, F. G., Sabaka, T. J., Nicholas, J. B., Mazarico, E., Rowlands, D. D., et al. (2016). “A global degree and order 1200 model of the lunar gravity field using grail mission data,” in 47th annual lunar and planetary science conference 1903, 1484.
Hansen, P. C., and O’Leary, D. P. (1993). The use of the L-curve in the regularization of discrete Ill-Posed problems. SIAM J. Sci. Comput. 14 (6), 1487–1503. doi:10.1137/0914086
Head, J. W. (1979). Serenitatis multi-ringed basin: Regional geology and basin ring interpretation. moon planets 21 (4), 439–462. doi:10.1007/BF00897836
Heck, B., and Seitz, K. (2007). A comparison of the tesseroid, prism and point-mass approaches for mass reductions in gravity field modelling. J. Geodesy 81 (2), 121–136. doi:10.1007/s00190-006-0094-0
Hiesinger, H., Jaumann, R., Neukum, G., and Head, J. W. (2000). Ages of mare basalts on the lunar nearside. J. Geophys. Res. Planets 105 (E12), 29239–29275. doi:10.1029/2000JE001244
Hikida, H., and Wieczorek, M. A. (2007). Crustal thickness of the Moon: New constraints from gravity inversions using polyhedral shape models. Icarus 192 (1), 150–166. doi:10.1016/j.icarus.2007.06.015
Jiang, W., Zhang, J., Tian, T., and Wang, X. (2012). Crustal structure of Chuan-Dian region derived from gravity data and its tectonic implications. Phys. Earth Planet. Interiors 212, 76–87. doi:10.1016/j.pepi.2012.07.001
Kaur, P., Bhattacharya, S., Chauhan, P., Kumar, A. K., and Kiran Kumar, A. (2013). Mineralogy of mare Serenitatis on the near side of the moon based on chandrayaan-1 moon mineralogy mapper (M3) observations. Icarus 222 (1), 137–148. doi:10.1016/j.icarus.2012.10.020
Kierfer, W. S., Macke, R. J., Britt, D. T., Irving, A. J., and Consolmagno, G. J. (2012). The density and porosity of lunar rocks. Geophys. Res. Lett. 39, L07201. doi:10.1029/2012GL051319
Kodama, S., and Yamaguchi, Y. (2003). Lunar mare volcanism in the eastern nearside region derived from Clementine UV/VIS data. Meteorit. Planet. Sci. 38 (10), 1461–1484. doi:10.1111/j.1945-5100.2003.tb00251.x
Last, B. J., and Kubik, K. (1983). Compact gravity inversion. Geophysics 48 (6), 713–721. doi:10.1190/1.1441501
Lemoine, F. G., Goossens, S., Sabaka, T. J., Nicholas, J. B., Mazarico, E., Rowlands, D. D., et al. (2014). GRGM900C: A degree 900 lunar gravity model from GRAIL primary and extended mission data. Geophys. Res. Lett. 41 (10), 3382–3389. doi:10.1002/2014GL060027
Li, B., Ling, Z., Zhang, J., Chen, J., Ni, Y., and Liu, C. (2018). Displacement-length ratios and contractional strains of lunar wrinkle ridges in Mare Serenitatis and Mare Tranquillitatis. J. Struct. Geol. 109, 27–37. doi:10.1016/j.jsg.2018.01.003
Liang, Q., Chen, C., and Li, Y. (2014). 3-D inversion of gravity data in spherical coordinates with application to the GRAIL data. J. Geophys. Res. Planets 119 (6), 1359–1373. doi:10.1002/2014JE004626
Liang, Q. (2010). Gravity anomaly features and 3D density imaging of the Moon. Ph. D. thesis (Wuhan: China University of Geosciences). (in Chinese).
Mallat, S. G. (1989). A theory for multiresolution signal decomposition: The wavelet representation. IEEE Trans. pattern analysis Mach. Intell. 11 (7), 674–693. doi:10.1109/34.192463
Maxwell, T. A., El-Baz, F., and Ward, S. H. (1975). Distribution, morphology, and origin of ridges and arches in Mare Serenitatis. Geol. Soc. Am. Bull. 86 (9), 1273–1278. doi:10.1130/0016-7606(1975)86<1273:DMAOOR>2.0.CO;2
Neumann, G. A. (2011). LRO MOON LASER ALTIMETER 4 GDR V1.0 [Data set]. NASA Planet. Data Syst. doi:10.17189/1520642
Pieters, C. M. (1978). Mare basalt types on the front side of the moon-A summary of spectral reflectance data. Lunar Planet. Sci. Conf. Proc. 9, 2825–2849.
Plescia, J. B., and Golombek, M. P. (1986). Origin of planetary wrinkle ridges based on the study of terrestrial analogs. Geol. Soc. Am. Bull. 97 (11), 1289–1299. doi:10.1130/0016-7606(1986)97<1289:OOPWRB>2.0.CO;2
Ryder, G., Norman, M. D., and Taylor, G. J. (1997). The complex stratigraphy of the highland crust in the Serenitatis region of the Moon inferred from mineral fragment chemistry. Geochimica Cosmochimica Acta 61 (5), 1083–1105. doi:10.1016/S0016-7037(96)00386-9
Sharpton, V. L., and James, W. H. (1982). Stratigraphy and structural evolution of southern mare Serenitatis: A reinterpretation based on Apollo lunar sounder experiment data. J. Geophys. Res. Solid Earth 87 (B13), 10983–10998. doi:10.1029/JB087iB13p10983
Solomon, S. C., and Head, J. W. (1979). Vertical movement in mare basins: Relation to mare emplacement, basin tectonics, and lunar thermal history. J. Geophys. Res. Solid Earth 84 (B4), 1667–1682. doi:10.1029/JB084iB04p01667
Spector, A., and Grant, F. S. (1970). Statistical models for interpreting aeromagnetic data. Geophysics 35 (2), 293–302. doi:10.1190/1.1440092
Staudacher, T., Dominik, B., Jessberger, E. K., and Kirsten, T. (1978). Consortium breccia 73255: 40AR-39AR dating. Lunar Planet. Sci. Conf. 9, 1098–1100.
Tikhonov, A. N., and Arsenin, V. Y. (1977). Solutions of ill-posed problems. New York: John Wiley & Sons.
Wan, J., Xu, C., Luo, Z., Wu, Y., Zhou, B., and Yan, J. (2019). An approach to moho topography Recovery using the on-orbit GOCE gravity gradients and its applications in tibet. Remote Sens. 11, 1567. doi:10.3390/rs11131567
Wang, J. G., Zhao, G. Q., and Zhu, G. B. (2009). Contrastive analysis of common computing methods of ultra-high degree and order fully normalized associated Legendre function. J. Geod. Geodyn.(in Chin. 29 (2), 126–130.
Watters, T. R., and Konopliv, A. S. (2001). The topography and gravity of mare Serenitatis: Implications for subsidence of the mare surface. Planet. Space Sci. 49 (7), 743–748. doi:10.1016/S0032-0633(01)00007-1
Watters, T. R. (1988). Wrinkle ridge assemblages on the terrestrial planets. J. Geophys. Res. Solid Earth 93 (B9), 10236–10254. doi:10.1029/JB093iB09p10236
Wieczorek, M. A., Neumann, G. A., Nimmo, F., Kiefer, W. S., Taylor, G. J., Melosh, H. J., et al. (2013). The crust of the Moon as seen by GRAIL. Science 339 (6120), 671–675. doi:10.1126/science.1231530
Wieczorek, M. A., and Phillips, R. J. (1999). Lunar multiring basins and the cratering process. Icarus 139 (2), 246–259. doi:10.1006/icar.1999.6102
Wieczorek, M. A., and Phillips, R. J. (1998). Potential anomalies on a sphere: Applications to the thickness of the lunar crust. J. Geophys. Res. Planets 103 (E1), 1715–1724. doi:10.1029/97JE03136
Wilhelms, D. E., McCauley, J. F., and Trask, N. J. (1987). The geologic history of the Moon. (No. 1348).
Xu, C., Liu, Z., Luo, Z., Wu, Y., and Wang, H. (2017). Moho topography of the Tibetan Plateau using multi-scale gravity analysis and its tectonic implications. J. Asian Earth Sci. 138, 378–386. doi:10.1016/j.jseaes.2017.02.028
Xu, C., Luo, Z., Sun, R., Zhou, H., and Wu, Y. (2018). Multilayer densities using a wavelet-based gravity method and their tectonic implications beneath the Tibetan Plateau. Geophys. J. Int. 213 (3), 2085–2095. doi:10.1093/GJI/GGY110
Keywords: gravity field, gravity inversion, lunar crust and mantle, mare serenitatis, MASCON
Citation: Yu H, Xu C, Wu Y, Li J, Jian G and Xu M (2023) Fine structure of the lunar crust and upper mantle in the mare serenitatis derived from gravity multi-scale analysis. Front. Astron. Space Sci. 10:1109714. doi: 10.3389/fspas.2023.1109714
Received: 28 November 2022; Accepted: 23 January 2023;
Published: 15 March 2023.
Edited by:
Changyi Xu, Institute of Geology and Geophysics (CAS), ChinaReviewed by:
Yawen She, Institute of Earthquake Forecasting, China Earthquake Administration, ChinaGuangliang Yang, China Earthquake Administration, China
Copyright © 2023 Yu, Xu, Wu, Li, Jian and Xu. This is an open-access article distributed under the terms of the Creative Commons Attribution License (CC BY). The use, distribution or reproduction in other forums is permitted, provided the original author(s) and the copyright owner(s) are credited and that the original publication in this journal is cited, in accordance with accepted academic practice. No use, distribution or reproduction is permitted which does not comply with these terms.
*Correspondence: Chuang Xu, chuangxu@gdut.edu.cn