Analysis of the influence of different initial velocities on dynamic performance of multi-layer hard target penetration process
 Peng Liu
 Jian Li
 Changsheng Li1
 - 1School of Mechanical Engineering, Nanjing University of Science and Technology, Nanjing, Jiangsu, China
- 2The 28th Research Institute of CETC, Nanjing, Jiangsu, China
To determine the overload characteristics of the internal system of a fuze that penetrates multilayer hard targets using different fixed-link structures, a finite element model consisting of two fixed-link structures (a compression screw and a body screw) is adopted in this paper to simulate the penetration process of a three-layer concrete target plate with corresponding initial velocities. The peak amplification coefficient and vibration coefficient are used to analyze the time-domain characteristics of the penetration process signal during segmented analysis. The extracted acceleration signals of the projectile and sensor are processed by fast Fourier transform to obtain the frequency spectrum analysis results. The simulation results show that under the same working conditions, the sensor’s ability to amplify the peak acceleration of the projectile is 17.77% higher for the body screw fixed-link structure, and the average vibration coefficient is also 9.55% higher. Compared with that of the body screw fixed-link structure, the performance of the compression screw fixed-link structure is better under different initial velocity conditions. The initial penetration velocity affects mainly the amplitude of each frequency corresponding to the acceleration signals of the two fixed-link fuze structure projectiles and sensors while having a relatively small influence on the frequency distribution position.
1 Introduction
In recent years, the military forces of various countries have become increasingly powerful, and the combat capabilities and defense systems of military weapons have become more sophisticated. Some important military targets have multiple layers of protective structures, which increase the requirements for the destructive power of weapons. These high-value targets have strengthened their protection measures mainly by increasing the strength, thickness, and complexity of the structure of protective materials, resulting in greater requirements for the penetration capability of projectiles and the detonation control capability of fuzes. Due to extreme shocks and the mechanical environment (the acceleration can reach several hundred thousand times the force of gravity, with millisecond-wide pulses) [1, 2] experienced by breakthrough fuzes, overloading discrimination is performed mainly by accelerometer sensors. However, differences in the solid connection structure between the projectile and the fuze leads to differences in the transmission characteristics of the shock load. This is reflected in the actual output signal of the sensor, which affects the accuracy of target information identification.
[3] proposed that the penetration acceleration signal of a sensor is composed of rigid body motion acceleration and vibration interference signals from kinetic projectiles, with both lateral and longitudinal interference signals. [4] suggested that the penetration acceleration signal is composed of signals on the Hz, kHz and MHz scales. The Hz signal is generated by rigid body motion, the kHz signal is caused by vibration of the penetrating body structure and the sensor, and the other MHz-level components are high-frequency noise interference signals. Later, [5] also proposed that the response signal characteristics can be used for the structural safety monitoring of penetrating projectiles, and relevant experimental work was carried out on the basis of this theory. [6] conducted filtering analysis of the measured penetration acceleration signals under different cutoff frequency conditions according to the signal frequency characteristics proposed by Lundgren. Craig Doolittle also compared the signals measured at different positions of the warhead and found that there were significant differences in the structural responses at different positions. Researchers at Sandia National Laboratories (SNL) [7] filtered the data from these two test points at the same frequency when constructing an empirical formula to determine the penetration of egg-shaped projectile bodies into soil. When the filter frequency reached 1 kHz, the filtered acceleration almost disappeared due to the influence of the projectile structure and the measurement system position, and Forrestal regarded the filtered result as the rigid body acceleration of the projectile. Researchers at SNL [8, 9] also conducted porous rock penetration experiments and decreased the filter frequency to 500 Hz to eliminate the high-frequency vibration of the projectile structure during data processing, thereby determining the rigid body acceleration of the projectile during the penetration process.
Due to the different perspectives of scholars regarding penetration acceleration analysis, the composition of the final penetration acceleration signal may vary. However, it can be summarized that the basic components of the penetration acceleration signal are rigid body acceleration, the structural response acceleration of the fuzing system, and high-frequency interference signals. Among them, the rigid body acceleration can be determined by Newton’s second law and is independent of the structural mechanical properties of the projectile; the structural response acceleration of the fuzing system is a complex structural response generated by the structural response of the warhead and the fuze structure under enormous external shock loads when the kinetic energy projectile penetrates the target plate.
In view of the characteristics of high-load impact during penetration, some scholars have adopted isolation measures to cushion protection measures. [10] and [11] found through finite element numerical simulation that viscoelastic polymer materials have a significant attenuation effect on stress as cushioning materials under impact loading. [12] used carbon fiber epoxy resin as a support plate to isolate electronic devices from the projectile, reducing stress and overload on the electronic devices during launch overload. [13] used rubber as a cushioning material to protect embedded single-package system equipment in an impact environment, and the research results showed that rubber significantly reduced the stress on the core SIP. This research showed that the application of cushioning protection materials can effectively eliminate some signal interference, allowing the fuzing system to identify the overload changes during the penetration process more accurately.
In addition, [14–16] studied the dynamic mechanical response between amorphous nanospheres using full atomistic molecular dynamics simulations, and their results have significant engineering implications for the material selection of fuzes in high-impact environments. [17] investigated the dynamic mechanical contact behavior and sintering mechanism of Al nanoparticles under high-speed impact, and their results are important for the application of high-energy nanomaterials in fuze penetration. M.A.N. [18] studied the energy absorption mechanism of nanolayered structures under ballistic impact loads, indicating that the vertical surface area of nanoscale projectiles plays an important role in absorbing impact energy during perforation processes. [19] conducted research on the resonant behavior of graphene nanostructures, and their results are expected to guide the development of lightweight materials resistant to impact. [20] studied the dynamic mechanical behavior of high-velocity projectile penetration through multilayer graphene, revealing that the specific penetration energy of multilayer graphene is more than 10 times higher than that of macroscopic steel plates at a velocity of 600 m per second.
In addition to the use of cushioning materials, the impact of different threaded connection methods on the vibration is also a scientific issue worth exploring. Generally, a fuze is installed at the tail of a projectile, where the rigidity is high and the fixation is reliable. Therefore, amplification of vibrations is relatively small. To facilitate replacement, the fuze is generally connected to the projectile by threaded connections or other methods. When the projectile hits a hard target, due to the various types of connections between the projectile and the fuze, the overload signal during penetration introduces response signals of different degrees during the process of transmission from the projectile to the internal sensor of the fuze. The overload signal detected by the built-in acceleration sensor of the fuze is not directly the overload during projectile penetration. Especially for body-threaded connection structures, collisions between the teeth of the threaded pair occur during the penetration process, causing severe vibrations of the fuze components, thereby introducing large interference signals into the overload signal of the fuze [21].
Research on the dynamic characteristics of threaded connection structures in the mechanical field mainly focuses on the loosening, destruction, and suppression of threads caused by dynamic loads at low frequencies and rarely involves objects such as target-penetrating fuzes [22, 23]. Due to the difficulty of performing real-time parameter measurements of projectile response characteristics, numerical simulation methods have become effective tools for studying structural response mechanisms and details. For both pressure-threaded connection structures and body-threaded connection structures, modeling and simulation processing of the threaded structure are involved in the research process. Toshimichi Fukuoka [24] proposed a method for creating a three-dimensional finite element mesh model. The mesh created by this method is distributed uniformly and considers details such as the thread helix angle and excessive rounding between the thread teeth. The model is relatively accurate, but the modeling process is very complex and requires a considerable amount of work. [25, 26] studied the impact transmission process of threaded fuze connections during penetration, used the Yamatoto method to regard threads as cantilever beams, derived the contact stiffness of the threaded structure, analyzed the overload transfer characteristics of the threaded fuze connection structure under impact loads, and decomposed the thread collision signal frequency in the acceleration signal spectrum using time-frequency analysis methods, thus proving that threaded connection structures introduce interference signals into the fuze response signal.
To date, many scholars have made many attempts to model threads and have studied some connection characteristics through simulations, but current research is still focused on the structural response to single impact conditions. The study of the dynamic characteristics of fuzes during penetration is also insufficient. In practical engineering, there are more multilayer target penetration conditions. In addition to studying the response acceleration in the impact stage, we also need to pay attention to the response acceleration of warhead and fuze systems during the transition stage of impact. Different penetration conditions also have different effects on the response acceleration, and there is an urgent need to study the response acceleration changes of typical fixed connection structures of warhead and fuze systems under different penetration conditions to provide technical support for reliability analysis, signal processing, and detonation control strategies.
The above research results show that due to the different perspectives regarding the analysis of the penetration acceleration, the composition of the final penetration acceleration signal obtained by different scholars differs. However, it can be concluded that the basic components of the penetration acceleration signal include rigid body acceleration, structural response acceleration of the warhead and fuze system, and high-frequency interference signals. Among them, the rigid body acceleration can be determined by Newton’s second law, which is independent of the structural mechanical properties of the projectile. Moreover, the structural response acceleration of the warhead and fuze system is a complex response caused by the very large external impact load on the structure of the warhead and fuze during the penetration of the high-kinetic-energy projectile into the target plate.
In this paper, we established finite element models of warhead and fuze systems with pressure-threaded connection structures and body-threaded connection structures, respectively, under different initial velocity conditions for the penetration of multiple layers of concrete target plates. Numerical calculations were performed to extract the acceleration signals of the projectile and sensors during the penetration process under the corresponding conditions, and the acceleration signal characteristics of the projectile and sensors under different conditions were compared and analyzed in the time and frequency domains to provide a reference for the selection of fixed connection structures in future fuze designs.
2 Response model
2.1 Equivalent response model of missile-fuze system
A missile-fuze system is a complex multi-mechanical system composed of a missile body, fuze shell, polyurethane, circuit board and sensor. The signal obtained by the acceleration sensor is the impact force between missiles used as the response signal of this complex mechanical system. Since the total mass of the circuit board and polyurethane is equivalent to the total mass of the sensor, the sensor, circuit board and polyurethane are separately considered in this study. The equivalent system model of the elastic ejecting system is simplified to a spring mass system with four degrees of freedom, as shown in Figure 1. Meanwhile, since damping can be ignored under impact conditions, the role of damping is not considered in this paper. Regarding the parameters, m1 is the total mass of the warhead and the simulated charge, m2 is the mass of the fuze shell, m3 is the total mass of the circuit board and polyurethane material inside the fuze, and m4 is the mass of the sensor of the key component. The contact between the fuse shell and the inner wall of the warhead is equivalent to a linear spring with a stiffness coefficient of k1. The contact between the inner polyurethane and the circuit board and the inner wall of the fuse shell is equivalent to a linear spring with a stiffness coefficient of k2. The contact between the sensor and the inner polyurethane and the circuit board is equivalent to a linear spring with a stiffness coefficient of k3.
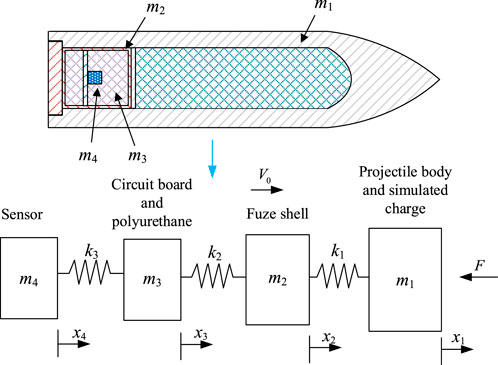
FIGURE 1. Multiple degrees of freedom transfer model of missile-fuze system.
Organize the above formula into
The initial conditions of the missile-fuze system during missile body penetration are as follows [27]:
2.2 Response signal model of sensor inside fuze
As seen from the above, the four-degree-of-freedom spring mass system is a multi-degree-of-freedom undamped forced motion system. To analyze and solve the above equation, mathematical eigenvalues are introduced for solving. That is, the principal vibration is assumed to be:
Then:
Let
Here, we can find four corresponding natural frequencies,
Since K is an off-diagonal matrix, statics decoupling is needed. First, the four natural frequencies obtained in Eq. 7 are substituted into
The principal mass matrix is:
There:
Here is a regular transformation of the coordinates:
Where, AN is the regular mode shape matrix, XN is the regular coordinates, and AN satisfies:
Where,
Similarly, the initial condition of the whole system in regular coordinates is
Acquirability
Under regular coordinates, the force on the missile-fuze system can be expressed as [28].
Through the above calculation, the multi-degree-of-freedom system in this paper has been decoupled and can be divided into multiple single-degree-of-freedom systems for solving. According to the Duhamel [29] integral principle, the general solutions of the forced motion of a system with one degree of freedom in a regular coordinate system for arbitrary excitation can be obtained.
When
When
When
When
Then, according to
So the response acceleration of m4 is:
By substituting the initial conditions into Eq. 25, we can get
there
It can be seen from the acceleration signal expression of the sensor in Eq. 26 that the acceleration signal of the sensor inside the missile-fuze system is composed of the rigid body acceleration generated by external excitation and the response acceleration generated in the process of signal transmission. The main factors affecting external excitation include the initial penetration velocity, target plate thickness and target plate bearing strength. The initial penetration velocity and target plate strength affect the peak value of excitation, while the initial penetration velocity, target plate strength and target plate thickness together affect the frequency of the excitation force. The main factors that affect the response acceleration of the missile system include the length-diameter ratio of the missile body, the equivalent connection stiffness of the missile system and the mass of each part. Regarding the two different connection modes, the pressure screw fixation structure and body screw fixation structure, the equivalent connection stiffness is different due to the difference in the connection structure, which will have different effects on the response signal. The following content will carry out specific research on this problem.
3 Model building of missile-fuze system
3.1 Geometric model of missile-fuze system
To study the influence of the elastoid-primed connection structure on the response acceleration of the elastoid-primed system, three-dimensional software was used to model the two connection modes of the elastoid-primed connection structure and body screw connection structure. As a key link in finite element analysis, modeling is not only directly related to the correctness of the analysis results but also affects the calculation cost. Therefore, in the process of modeling the test missile, geometric cleaning, repair and simplification of the model were carried out. The specific geometric shape is shown in Figure 2. The length of the missile body is 425 mm, the diameter is 125 mm, and the caliber-radius-head is 3.4.
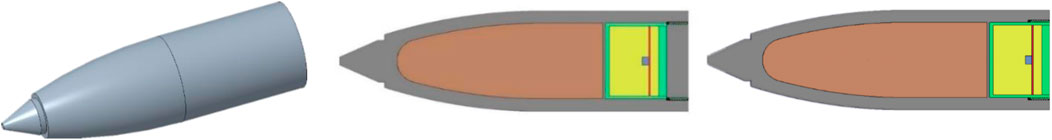
FIGURE 2. Geometric model of the missile body (pressure and body screw).
The internal structure of the test missile is mainly composed of two parts: simulated charge and fuze. These parts are installed at the bottom of the missile body differently. The simulated charge is installed on the fixing screw, and the fuze is installed on the body thread, as shown in Figure 2.
To study the dynamic response characteristics of the test missile and its internal fuze structure under an impact load, it is necessary to analyze the vibration characteristics of the whole structure of the test missile to obtain the response frequency of the system structure during penetration. Since the length and diameter ratio of the experimental missile in this paper is small (CHR = 3.4) and the fuze structure of the missile body is relatively complex, modal analysis is introduced here to analyze the natural vibration frequency of the missile body. The modes belong to the natural vibration characteristics of the mechanical structures, and each mode has a specific natural frequency, damping ratio and mode shape. If the main modal characteristics of the whole structure within the study frequency range are obtained through modal analysis, then the actual structural vibration response characteristics of the structure under the action of various internal or external vibration sources in this frequency band can be predicted. Therefore, finite element simulation software is used to carry out the modal analysis of two typical missile-fuze systems with fixed structures.
3.2 Finite element model of modal analysis
The commonly used modal extraction methods in finite element analysis are as follows: the block Lanczos method, the subspace method, the power dynamics method, the reduced method, the unsymmetrical method and the damped method. After a comparative study of the above methods, the block Lanczos method was selected to extract the modes and vibration modes of the test missile, and the modal module in the finite element software Workbench was used for the analysis and to determine the solution.
Regarding modal analysis, whether it is a full-missile model or not has a great influence on the natural vibration frequency. Therefore, the full-missile geometric model of the missile launching system with two kinds of fixed structures is imported into the Workbench software for finite element mesh division. The overall mesh size of the model is controlled at 3 mm, and the cell type is solid185. The mesh is dominated by hexahedral and tetrahedral elements. The elastic traction system model of the pressed screw and fixed connection structure is divided into 663,648 mesh elements, and the elastic traction system model of the body screw and fixed connection structure is divided into 710,844 mesh elements, as shown in Figure 3.
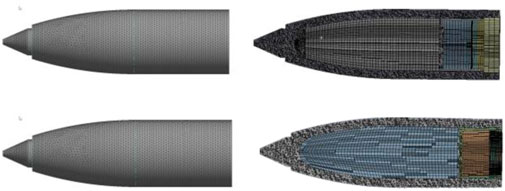
FIGURE 3. Finite element model of missile-fuze system with pressure and body screw fixation.
3.3 Constitutive model and material parameters
The material constitutive model, also known as the mechanical constitutive equation of the materials, mainly describes the relationship between the stress and strain of the materials under the action of stress and is a comprehensive representation of the macroscopic mechanical properties of the materials. Therefore, the correct constitutive model plays an important role in the accuracy of the numerical simulation.
The missile-fuze system model is composed of multiple parts, including the missile body, simulated charge, fuze and internal related devices. The specific material properties are shown in Table 1. The main material parameters involved include the density, elastic modulus and Poisson’s ratio.
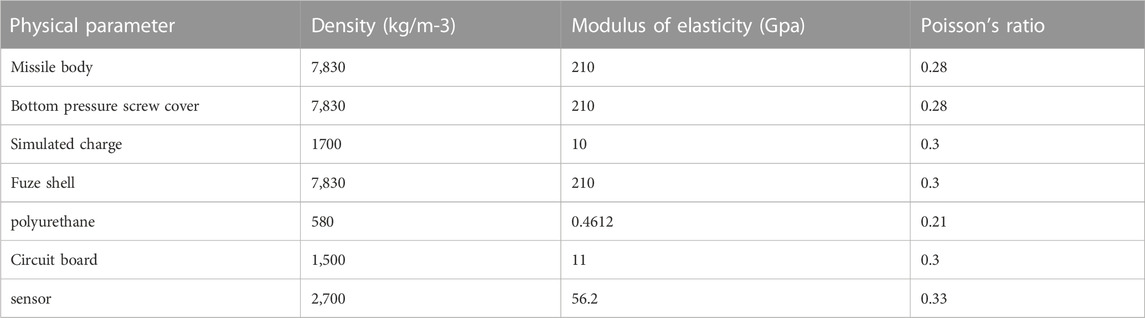
TABLE 1. Modal analysis of material parameters.
Polyurethane foam material, as a potting material for electronic components, has a high yield strength, can provide protection, and reduce the vibration of internal electronic components under high impacts and high overload conditions. The polyurethane material model used in this paper is the *MAT_CLOSED_CELL_FOAM model. This model is generally used to describe low-density closed-cell foam materials, is non-directional and accounts for the effect of gas pressure in the pore of the material on the material properties. Its stress can be described as follows:
Where,
Where,
Where, V is the relative volume, obtained by the ratio of the current volume to the initial volume; γ0 is the initial volume strain, usually 0. The yield conditions are determined by the yield limit of the main polyurethane skeleton and are not affected by the gas pressure in the bubble. The stress of polyurethane skeleton is:
Where E is Young’s modulus. Since Poisson’s ratio is 0, each stress component is uncoupled and satisfies the equation (2G) = E, where G is the shear modulus. When the stress component of the main test is greater than the yield stress σy, the yield condition is applied to the principal bone stress.
The polyurethane foam material used in this paper consists of two components, isocyanate and polyol, with a potting and sealing ratio of 1:1 and an overall density of 580 kg/m-3. The loading yield stress curve is the stress‒strain curve of polyurethane with a density of 580 kg/m-3 under different strain rates obtained by the static pressure test and Hopkinson bar impact test, as shown in Figure 4 [30]. In the simulation process, the yield stress is obtained by calculating the input curve.
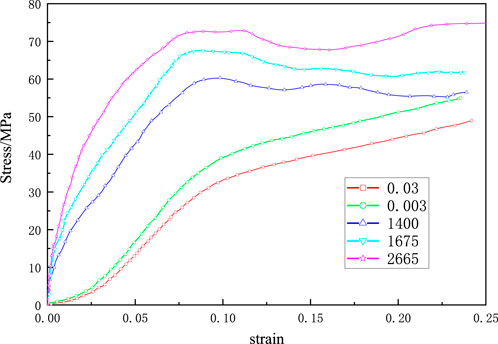
FIGURE 4. Stress-strain curves of polyurethane with a density of 0.58g/cm3 at different strain rates.
4 Analysis of time domain characteristics
To study the impact of the warhead penetration initial velocity on the dynamic performance of missile ejection systems in the process of penetrating multi-layer hard targets, In order to accurately describe the characteristics of signals, feature parameters in the time and frequency domains are usually extracted for characterization [31, 32], two finite element models of missile ejection systems with solid structures are adopted in this paper to penetrate three-layer concrete targets. Moreover, corresponding numerical simulation calculations of the penetration process are carried out with initial velocities of 500 m/s, 760 m/s, 1,000 m/s and 1,200 m/s. The bearing strength of the concrete target plate is 40 MPa, the thickness of the target plate is 15 cm, and the spacing between the two layers of the target plate is 90 cm. The dynamic response signals of two kinds of fixed structure missile systems in the process of penetration are analyzed respectively.
4.1 Analysis on the influence of time-domain characteristics with pressure screw structure
The response acceleration curves of the internal acceleration sensor components of the warhead and fuze in the missile priming system under different initial velocities were extracted, as shown in Figure 5. The acceleration signals of the missile body and sensor under different initial penetration velocity conditions are analyzed successively from the perspective of the time domain and frequency domain.
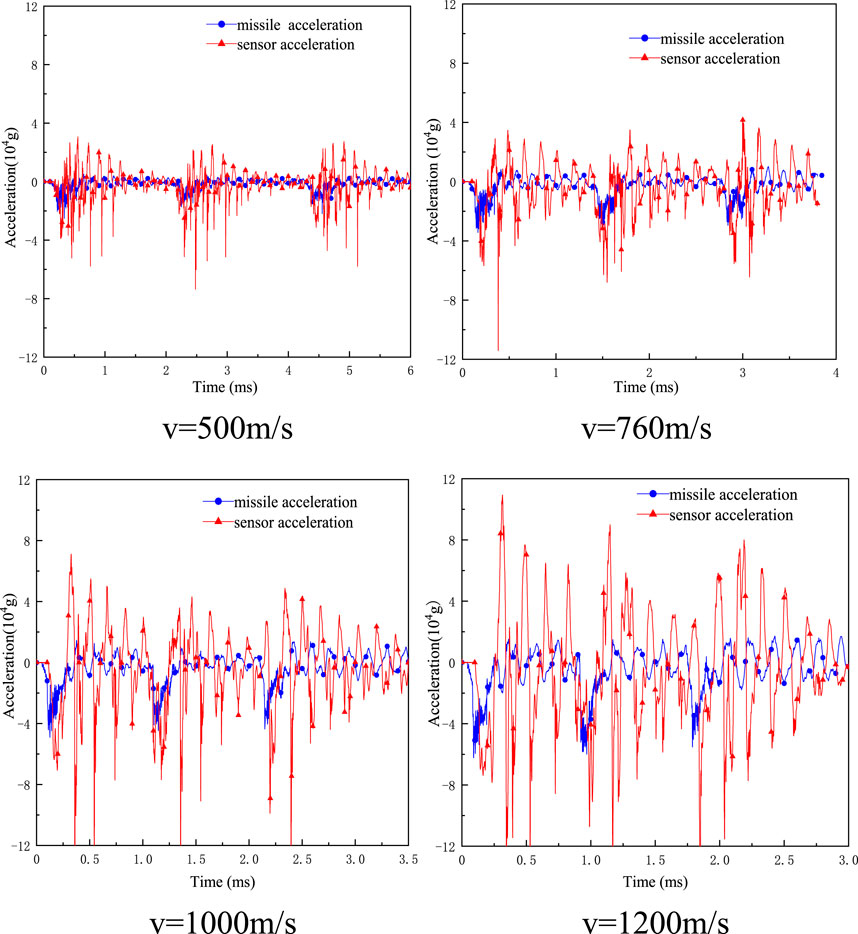
FIGURE 5. Acceleration signals of the missile-fuze system with pressure screw fixation (different initial velocities).
To filter out part of the high-frequency interference signals, 10 kHz was taken as the cutoff frequency, and second-order Butterworth low-pass filtering was carried out on the acceleration signals of the missile body and sensor of the missile primed system under pressure with a screw solid connection structure under different initial velocity conditions. The filtered curve is shown in Figure 6. In this paper, the whole penetration process is divided into two stages: the phase of the missile egg penetrating through the target plate and the phase of the missile moving between the layers of the target plate. The peak amplification coefficient and vibration coefficient are used to analyze the segmenting time domain characteristics of the penetration process signals.
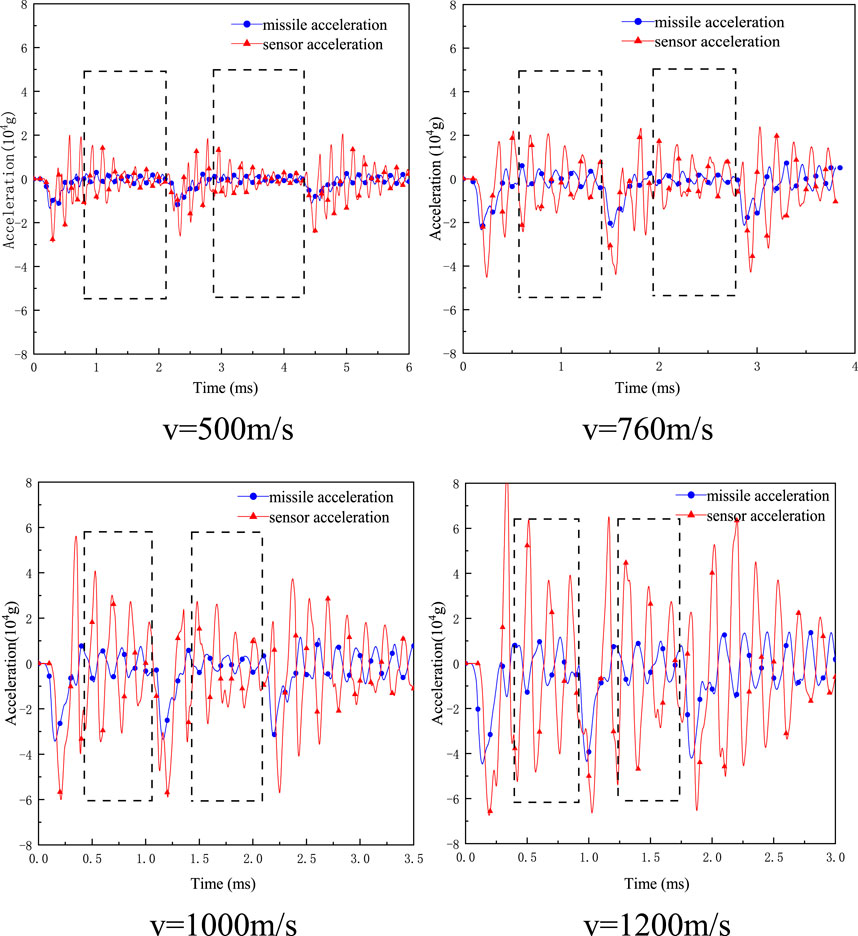
FIGURE 6. Acceleration signals of screw-to-solid missile-fuze system (different initial velocity, filtered at 10 kHz).
(1) Influence of initial penetration velocity on peak amp-lification coefficient (phase of missile oocyte penetration through target plate).
From Figure 6, the peak acceleration A and B of the missile body and sensor of the scree-solid penetration model under different initial velocities were extracted at the stage of penetrating the target plate at the egg part of the missile body. Since the peak acceleration of the missile launching system in the process of penetrating the target plate poses a high threat to the safety and reliability of the fuze, the signal feature mainly concerned in this paper is the maximum peak acceleration at the penetrating stage. In order to evaluate the amplification ability of the fixed structure to the peak acceleration of the missile body, the peak amplification factor P is proposed here to represent the amplification ability of the sensor’s peak acceleration relative to the peak acceleration of the missile body.
Where,
To comprehensively evaluate the amplification ability of the sensor to the missile body signal in the multi-layer penetration process of the missile launching system, the average amplification coefficient Pa is defined as
Where,
The corresponding peak amplification coefficient P and average amplification coefficient Pa are calculated, and the results are shown in Table 2. In this paper, the peak acceleration is analyzed from two aspects: the variation trend of the peak acceleration when the missile-fuze system penetrates the first layer target plate and the variation trend of the peak amplification coefficient when the missile-fuze missile system penetrates the third layer target plate.
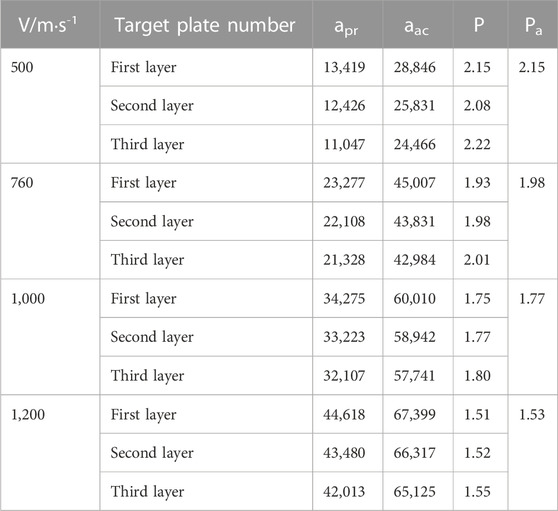
TABLE 2. Peak acceleration (different initial velocity, filtered at 10 kHz) of the missile-fuze system with pressure screw fixation.
The initial penetration velocities analyzed in this paper are 500 m/s, 760 m/s, 1,000 m/s and 1,200 m/s. The peak acceleration apr of the missile body when penetrating the first-floor target plate at the corresponding velocities is 13,419 g, 23,277 g, 34,275 g and 44,618 g, respectively. The peak accelerations aac of the sensor are 28,846 g, 45,007 g, 60,010 g and 67,399 g, respectively. The above results show that with the increase in the initial penetration velocity of the missile launching system, the peak acceleration of the missile body when penetrating the first layer target plate increases, the response peak acceleration of the sensor inside the fuze of the pressure screw solid structure also increases, and the corresponding velocity aac is much greater than apr. By further comparing the peak acceleration of the sensor with the corresponding peak acceleration of the missile body, it can be seen that in the process of penetrating three layers of concrete, the average amplification coefficients Pa of the sensor of the elastic priming system of the pressed and fixed structures under different initial velocities are 2.15, 1.98, 1.77 and 1.53, respectively. With the increase in the initial penetration velocity of the missile launching system, the average amplification coefficient Pa presents a downward trend, indicating that the amplification ability of the sensor to the acceleration signal of the missile body decreases with the increase in the initial penetration velocity.
(2) Influence of the initial penetration velocity on the vibration coefficient (interlayer motion stage).
Ls-Prepost was used to observe the time when the egg part of the missile body penetrated the target plate and the time when the missile body head hit the target in each penetration model, and the corresponding interlayer penetration acceleration signal was extracted according to the corresponding time. In this paper, the vibration coefficient AA was proposed. To measure the degree of the vibration disturbance of the sensor response acceleration signal in the interlayer motion period of the missile-fuze system and avoid providing qualitative results only with subjective judgment, the vibration coefficient of the interlayer motion (hereinafter referred to as the vibration coefficient) AA was proposed based on the research in this paper to represent the overall disturbance of the sensor acceleration signal in the interlayer motion period. Obviously, the larger AA is, the greater the degree of overall oscillation disturbance of the sensor signal in the process of interlayer movement. To ensure the effectiveness of the coefficient evaluation, the measurement results of the global vibration between the layers should be consistent with the physical meaning.
The input of vibration coefficient includes: amplitude of acceleration signal of sensor, frequency of signal acquisition, number of penetration layers, target time of each layer, and time of egg part penetrating target plate. Here, a(n) is the acceleration signal of the sensor, and the unit of amplitude is g; Ti is the time when the warhead of layer i enters the target, ti is the time when the egg part of the missile body of layer i penetrates the target plate, i is the number of layers, i = 1,2; The sampling interval of acceleration signal is Tm (unit: μs). So the vibration coefficient between layer i and layer i+1,
Then, the average vibration coefficient of interlayer motion (hereinafter referred to as the average vibration coefficient) Ra is defined as
The calculation results are shown in Table 3.
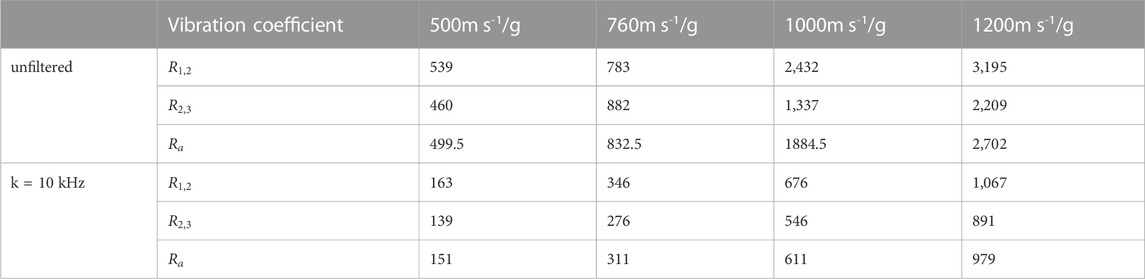
TABLE 3. Vibration coefficient (different initial velocity) of the sensor signal.
When the acceleration signal of the pressure screw solid structure sensor is not filtered, the average vibration coefficients Ra corresponding to 500 m/s, 760 m/s, 1,000 m/s and 1,200 m/s are 499.5 g, 832.5 g, 1884.5 g and 2,702 g, respectively. With the increase in the initial penetration velocity, the average vibration coefficient of the acceleration signal of the sensor increases along with the corresponding overall vibration disturbance degree during the interlayer movement of the elastic priming system of the pressed screw and fixed connection structure, which is consistent with the observed results. When the sensor signal is processed by 10 kHz low-pass filtering, the average vibration coefficient Ra under different initial velocity conditions is 151 g, 311 g, 611 g and 979 g successively. Compared with the average vibration coefficient under the corresponding velocity without filtering, it decreases to different degrees. However, the average vibration coefficient Ra of the acceleration signal of the sensor does not change, and the disturbance degree still increases with an increasing penetration velocity.
By comparing the average vibration coefficient Ra without filtering after 10 kHz low-pass filtering, the average vibration coefficient Ra corresponding to different initial velocities decreases by 348.5 g, 521.5 g, 1,273.5 g and 1723 g, respectively. The descending amplitude increases with an increasing initial penetration velocity, indicating that the amplitude of the high-frequency interference signal increases with an increasing initial penetration velocity.
4.2 Analysis on the influence of time-domain characteristics with body screw structure
By The response signals of the missile body and acceleration sensor of the missile launching system with a body-threaded fixed structure under different penetration initial velocities were extracted, as shown in Figure 7. The acceleration signals under different penetration initial velocities were analyzed from the perspectives of the time domain and frequency domain.
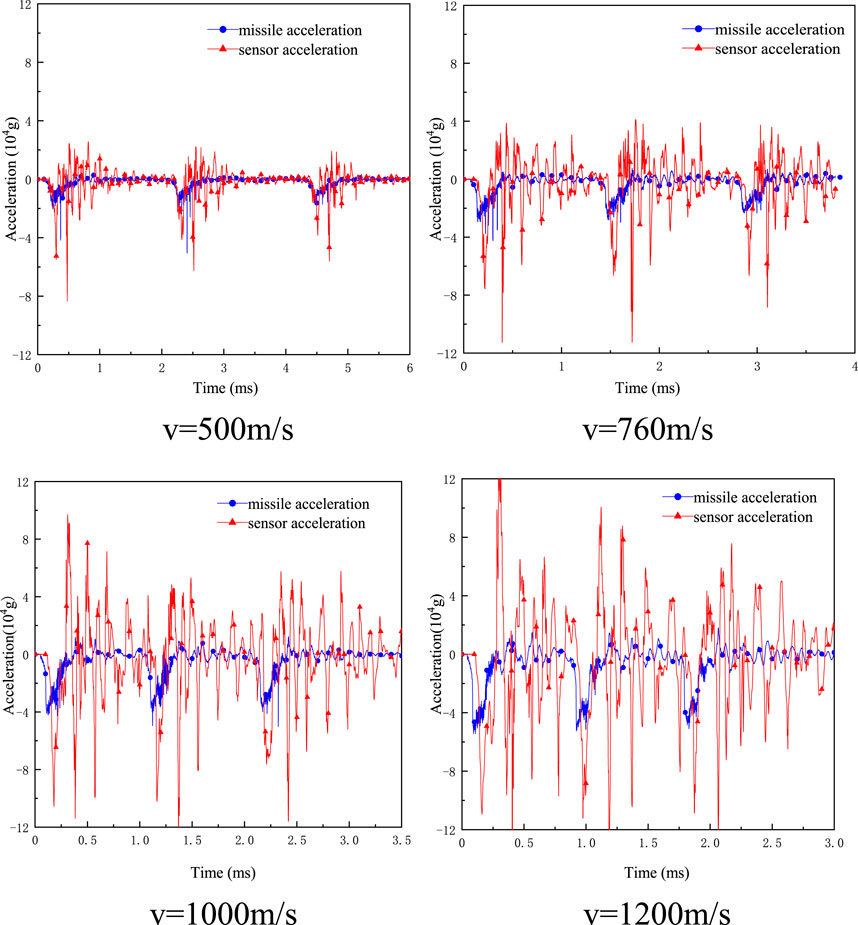
FIGURE 7. Acceleration signals of the missile-fuze system with pressure screw fixation (different initial velocities).
Taking 10 kHz as the cutoff frequency, second-order Butterworth low-pass filtering was carried out on the acceleration signals of the missile body and sensor of the bullet-priming system with a body-threaded fixed structure under different penetration initial velocities, as shown in Figure 7. The filtered curve is shown in Figure 11. The time-domain characteristics of the acceleration signals of the penetration process under four different working conditions are analyzed by using the peak amplification coefficient and vibration coefficient.
From Figure 8, the peak acceleration apr and aac of the missile body and sensor of the penetration model of the body’s solid threaded structure at different initial velocities at the stage of the missile’s egg part penetrating the target plate were extracted, and the peak amplification coefficients P and average amplification coefficients Pa were calculated, and the results were shown in Table 4.
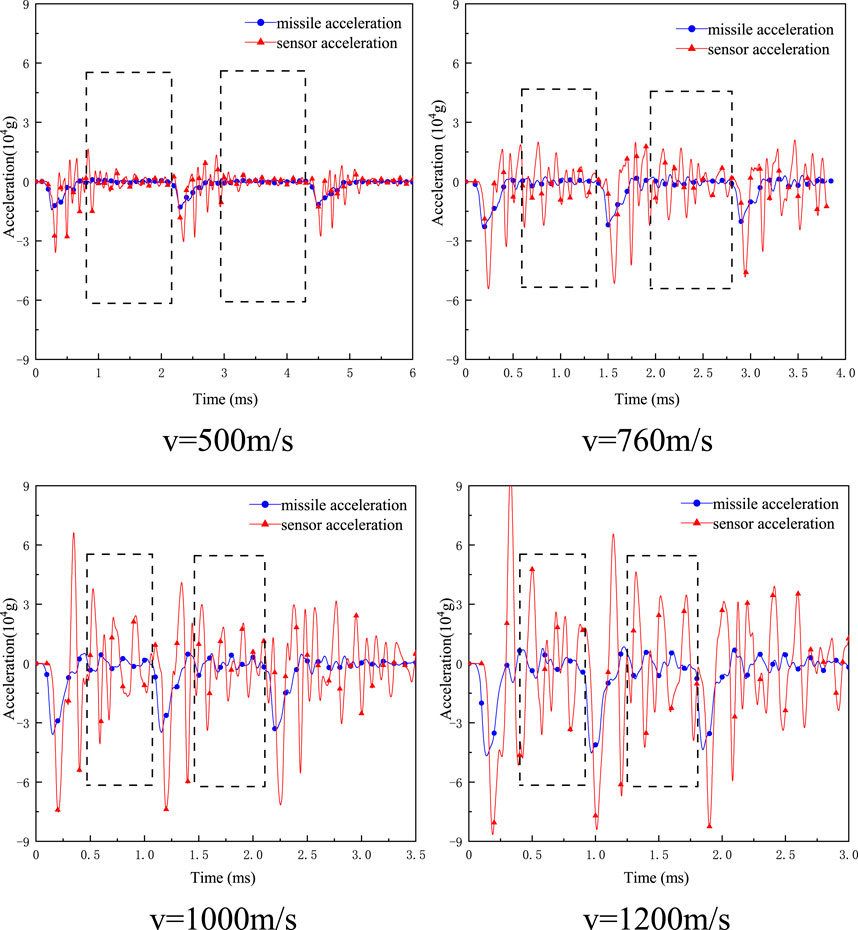
FIGURE 8. Acceleration signals of screw-to-solid missile-fuze system (different initial velocity, filtered at 10 kHz).
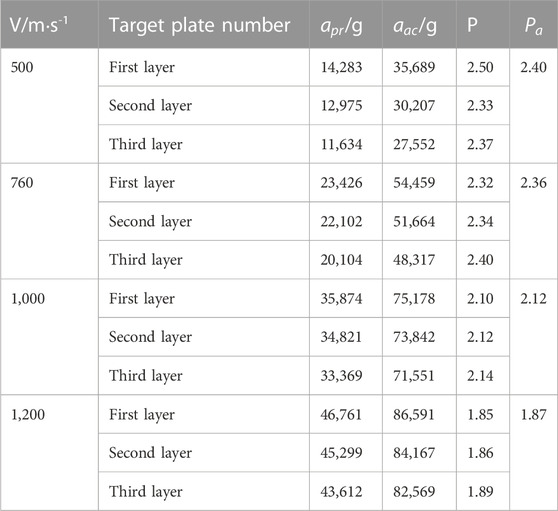
TABLE 4. Peak acceleration (different initial velocity, filtered at 10 kHz) of the missile-fuze system with body screw fixation.
When the model penetrates the first-floor target plate, the peak acceleration apr corresponding to initial penetration velocities of 500 m/s∼1,200 m/s is 14,283 g, 23,426 g, 35,874 g and 46,761 g, respectively. The peak accelerations of Sensor aac are 35,689 g, 54,459 g, 75,178 g and 86,591 g, respectively. The peak accelerations of the missile body and sensor increase with an increasing initial penetration velocity, and the variation trend is consistent with that of the pressure screw fixation structure. The peak acceleration aac of the sensor at the corresponding velocity is much greater than the peak acceleration apr of the missile body. Regarding the bullet-priming system with the body screw fixation structure, the average amplification coefficient Pa of the sensor signal is 2.40, 2.36, 2.12 and 1.87 under four different initial velocities, and it shows a decreasing trend with an increasing initial penetration velocity, which is consistent with the change trend of the pressure screw fixation structure.
4.3 Comparative analysis of time-domain characteristics
By comparing the peak acceleration aac and the average amplification factor Pa of the sensors of the two kinds of fixed structure missile systems, it can be seen that the peak acceleration aac of the sensors of the body thread fixed structure when they penetrate the first layer target plate is greater than that of the pressure screw fixed structure under the condition of corresponding initial velocity, as shown in Figure 9. Moreover, the average amplification coefficient Pa is greater than that of the pressure screw fixed structure at the corresponding speed, as shown in Figure 9. The above simulation results show that under different initial velocity conditions, the amplification ability of the body acceleration is stronger than that of the pressure screw fixation structure, and the overload of the fuze with the body screw fixation structure is larger under the same penetration condition.
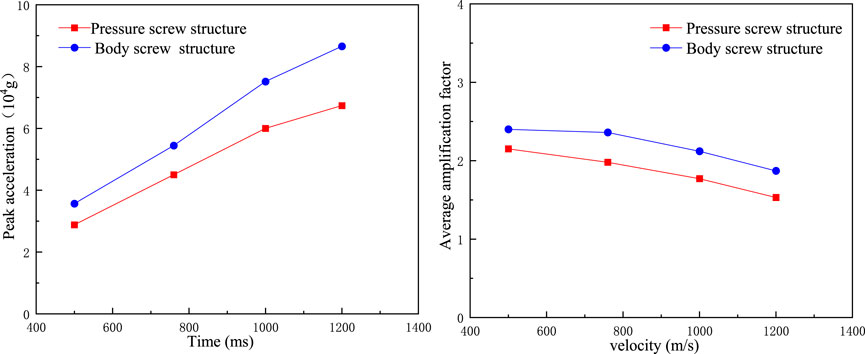
FIGURE 9. Sensor peak accelerations and average amplification factor.
Ls-Prepost was used to observe the time when the egg part of the missile body penetrated the target plate and the time when the missile body head hit the target in each penetration model. According to the corresponding time, the corresponding interlayer penetration acceleration signal of the sensor was extracted, and the signal was replaced into the interlayer vibration coefficient Ri,i+1 for calculation. The calculation results are shown in Table 5.
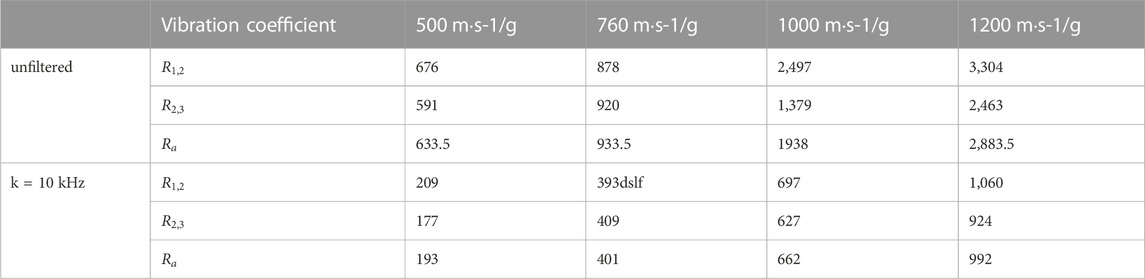
TABLE 5. Vibration coefficient of sensor signal of body screw fixed priming system (different initial velocity).
When the acceleration signal of the sensor of the body-threaded solid priming system is not filtered, the average vibration coefficient Ra under different penetration initial velocity conditions is 633.5g, 933.5g, 1938g and 2,883.5g, which increases with the increase of penetration initial velocity, and the corresponding overall disturbance degree also increases with the increase of penetration initial velocity. When the sensor acceleration signal is filtered by 10 kHz, the average vibration coefficient Ra under the corresponding speed decreases to different degrees, but the overall trend does not change, which are 193g, 401g, 662g and 992 g respectively. By comparing the average vibration coefficient Ra without filtering with the corresponding Ra after 10 kHz filtering, it can be seen that after 10 kHz low-pass filtering, The average vibration coefficients Ra of the body screw fixation structure at different initial velocities decreased by 440.5g, 532.5g, 1276 g and 1891.5g, res-pectively, and showed an increasing trend with the increase of penetration initial velocity, indicating that the amplitude of high-frequency interference signal increased with the increase of penetration initial velocity.
By comparing the average vibration coefficient Ra of the two structures, it can be seen that the average vibration coefficient Ra of the structure with body screw fixation at the corresponding speed is greater than that of the structure with pressure screw fixation., as shown in Figure 10, indicating that the overall disturbance degree of the acceleration signal during the interlayer movement of the elastic system with body screw fixation is greater than that of the structure with pressure screw fixation.
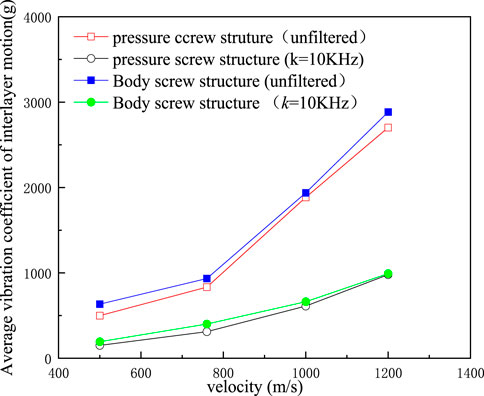
FIGURE 10. The Average Vibration Coefficient of the Sensor in a typical missile-priming system with Fixed structure (different initial velocities).
5 Analysis of frequency domain characteristicsl
5.1 Analysis on the influence of frequency domain characteristics pressure screw structure
To study the distribution and variation of the acceleration signals of the missile body and sensor in the frequency domain of the missile-fuze system with a pressure screw solid structure under different penetration velocities, the extracted acceleration signals of the missile body and sensor were processed by fast Fourier transform. The obtained spectral analysis results are shown in Figures 11, 12.
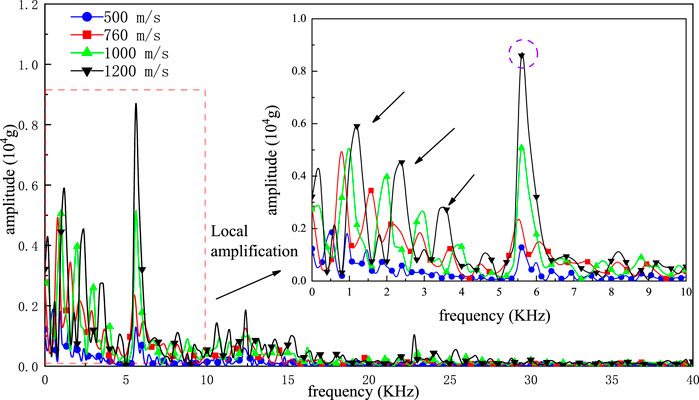
FIGURE 11. Spectrum diagram of acceleration signal of missile body (different muzzle velocity) in a press-screw solid missile-fuze system.
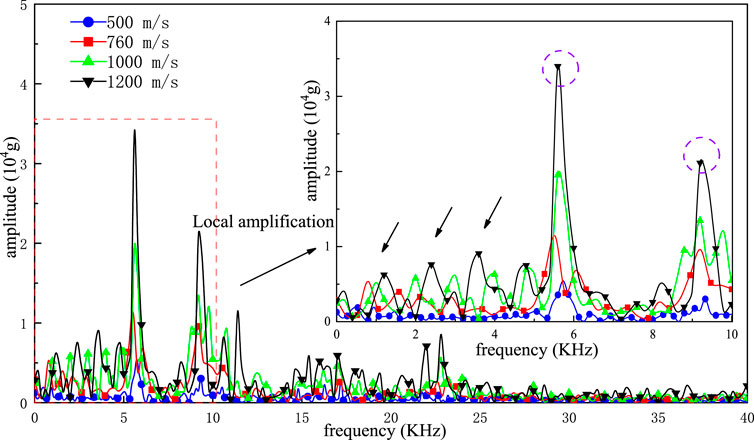
FIGURE 12. Spectrum diagram of acceleration signal of sensor (different muzzle velocity) in a press-screw solid missile-fuze system).
Figure 11 shows the spectrum diagram of the acceleration signals of the missile body under different initial velocities during penetration. When the initial velocities of the penetration are different, the distribution positions of the acceleration signals of the missile body in the frequency domain are basically the same, and the main difference lies in the amplitude. From the perspective of the overall distribution, the frequency distribution of the missile body acceleration signal is mainly concentrated in the range of 0–5 kHz, and there is a single peak with a high amplitude in the range of 5 kHz–10 kHz. When it exceeds 10 kHz, many peaks with small amplitudes appear in the frequency domain. The frequency distribution in the three ranges is analyzed successively below.
In the range of 0–5 kHz, there are several peaks with different amplitudes in the frequency domain, and the amplitudes of the peaks increase with an increasing initial penetration velocity, indicating that the overload in the low-frequency range increases with an increasing initial penetration velocity. This is consistent with the analysis results in the time domain. At the same time, the frequency corresponding to the peak also shifted slightly to the right with an increasing muzzle velocity. This indicates that the higher the muzzle velocity of the missile is, the higher the corresponding frequency of the low-frequency signal generated in the process of penetrating the same target plate, which is consistent with the objective cognition. In the range of 5 kHz–10 kHz, the peak of the missile body near 5.524 kHz is the resonant peak, and the amplitude of the peak increases with an increasing initial penetration velocity, indicating that the initial penetration velocity will affect the resonance peak. When the frequency exceeds 10 kHz, the high-frequency peak increases gradually with an increasing initial penetration velocity, and the corresponding amplitude of the peak also increases, indicating that the high-frequency component of the missile acceleration signal increases with an increasing initial penetration velocity. Moreover, the interference signal increases gradually.
Figure 12 is the spectrum diagram of the acceleration signals of the internal acceleration sensor of the compressed helical structure under different initial velocity conditions in the process of penetration. Compared with the frequency distribution of the missile body signal in Figure 11, it can be seen that when the frequency is less than 2 kHz, the amplitude of each frequency of the sensor signal under different initial velocity conditions is basically consistent with the corresponding missile body signal; however, when the frequency exceeds 2 kHz, the acceleration signal of the sensor is amplified to different degrees compared with the signal of the missile body.
From the perspective of the overall distribution, the frequency distribution position of the sensor acceleration signal under different penetration conditions is basically the same and mainly concentrated in the range of 0–10 kHz. Moreover, many spikes with large amplitudes occur in the range of more than 10 kHz. The main difference is that the amplitudes of each spike are different. In the range of 0–5 kHz, there are several peaks with different amplitudes in the frequency domain of the sensor acceleration signal, the corresponding amplitudes of the peaks increase with an increasing initial penetration velocity, and the corresponding frequencies shift slightly to the right with an increasing initial velocity. The changing trend is consistent with the change trend of the low-frequency signals of the missile body in the range of 0–5 kHz. In the range of 5 kHz–10 kHz, the resonant peak of the sensor signal has a large amplitude near 5.524 kHz and 9.208 kHz, and the peak value increases with an increasing initial penetration velocity and is much larger than the resonant peak value of the corresponding missile body. When the frequency exceeds 10 kHz, the high-frequency peak gradually increases with an increasing initial penetration velocity, and the corresponding amplitude also increases, indicating that the high-frequency component of the sensor acceleration signal increases with an increasing initial penetration velocity. Additionally, the interference signal gradually increases, which is consistent with the analysis results in the time domain.
The above analysis shows that the initial penetration velocity mainly affects the amplitude corresponding to each frequency of the acceleration signal of the missile body and sensor in the pressure screw solid missile launching system and has little influence on the frequency distribution position. With an increasing initial penetration velocity, the corresponding amplitude of each frequency of the missile body and sensor signal increases.
5.2 Analysis on the influence of frequency domain characteristics body screw structure
To study the distribution variation of the acceleration signals of the missile body and sensor in the missile launching system with a body screw fixation structure under different initial velocity conditions in the frequency domain, a fast Fourier transform was used to analyze the extracted acceleration signals of the missile body and sensor. The results are shown in Figure 13.
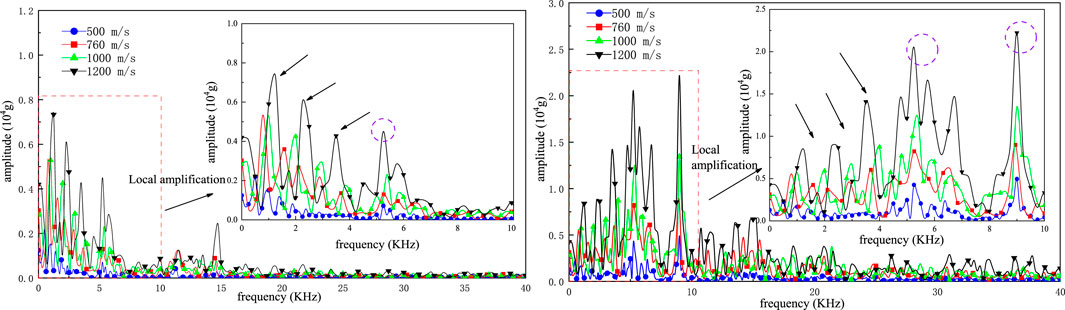
FIGURE 13. Spectrum diagram of acceleration signal of missile body and sensor (different muzzle velocity) in a body-screw solid missile-fuze system.
Figure 13 shows the spectrum diagram of the acceleration signals during the penetration of a missile with a body screw fixation structure under different penetration initial velocities. When the penetration initial velocities are different, the distribution law of the acceleration signals in the frequency domain of the missile is basically similar to the spectrum of the missile with the pressure screw fixation structure.
From the overall distribution, the frequency distribution of the missile body acceleration signal is mainly concentrated in the range of 0–5 kHz, showing several peaks with different amplitudes. With an increasing initial penetration velocity, the amplitude of the peak increases, and the corresponding frequency shifts slightly to the right, indicating that the higher the initial penetration velocity of the missile body is, the higher the corresponding frequency of the low-frequency signal generated during the process of penetrating the same target plate. In the range of 5 kHz–10 kHz, the body signal resonates at approximately 5.261 kHz, and the amplitude of the resonant peak increases with an increasing initial penetration velocity. When the frequency exceeds 10 kHz, the high-frequency peak increases gradually with an increasing initial penetration velocity. The corresponding amplitude also increases, indicating that the high-frequency component of the acceleration signal of the body screw fixed missile increases with an increasing initial penetration velocity. Moreover, the interference signal increases gradually.
Figure 13 is the spectrum diagram of the acceleration signal of the sensor inside the body screw fixed structure during penetration under different muzzle velocity conditions. Compared with the frequency distribution of the missile body signal in Figure 17, it can be seen that when the frequency is less than 2 kHz, the amplitude of each frequency of the sensor signal under different muzzle velocity conditions is basically consistent with the corresponding missile body signal; however, when the frequency exceeds 2 kHz, the amplitudes of each frequency of the sensor acceleration signal are amplified to different degrees compared with the body signal.
The studies mentioned above place significant emphasis on practical engineering applications. The analysis results will provide effective guidance for future engineering applications, aiding in resolving key challenges related to the penetration of hard targets. The key innovative aspects of this paper are summarized in Table 6.
TABLE 6. Highlight innovation points.
5.3 Comparative analysis of frequency domain characteristics
From the perspective of the overall distribution, the frequency distribution of the acceleration signal of the sensor is similar to that of the signal spectrum of the sensor in the pressure screw fixed structure, mainly concentrated in the range of 0–10 kHz, and there are a large number of small amplitude peaks in the range of more than 10 kHz. In the range of 0–4 kHz, there are several peaks with different amplitudes in the frequency domain, and the peak amplitudes increase with the increase of the initial penetration velocity, and the corresponding frequencies shift slightly to the right with the increase of the initial velocity, and the changing trend is consistent with that of the low-frequency signal of the missile body. However, in the range of 4 kHz–10 kHz, the sensor signal has a resonant peak with large amplitude near 5.261 kHz and 8.945 kHz, corresponding to the harmonic response analysis results, and the peak value increases with the increase of the initial penetration velocity. When the frequency exceeds 10 kHz, the high frequency peak increases gradually with the increase of penetration initial velocity and the corresponding amplitude also increases, indicating that the high frequency component of the sensor acceleration signal increases with the increase of penetration initial velocity, and the interference signal increases gradually.
6 Experimental verification
To verify the correctness of the finite element model of three layers of concrete penetrated by two fixed structural projectile systems, a dynamic penetration test study on the firing range was carried out. In the penetration experiment, a 125 mm caliber gun was used as the experimental platform to launch the experimental projectile, and the acceleration signal of the projectile body in the process of penetration was recovered circuit board and acceleration curve comparison are shown in Figures 14, 15.
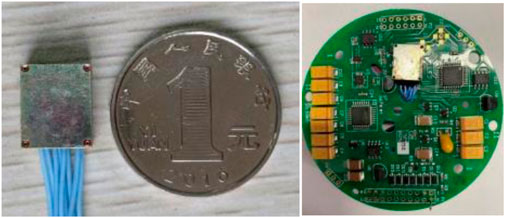
FIGURE 14. Physical diagram of circuit board and sensor of missile - borne storage system.
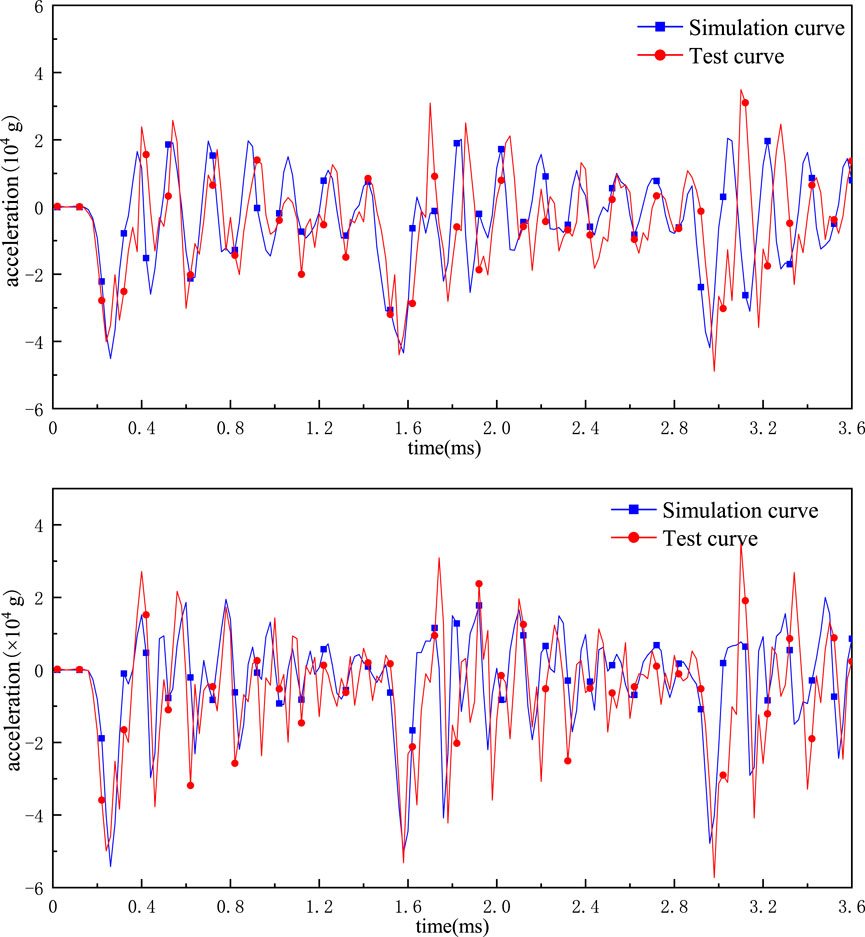
FIGURE 15. Acceleration curve of pressure and body screw structure during penetration process.
Since the internal vibration of the missile-fuze system during penetration is relatively complex, the output signal is related to the sensor parameters, field test conditions, etc., and the resulting data under the same conditions are not stable but have certain fluctuations. While the finite element model is a simulation calculation under ideal conditions, the results of multiple calculations of the same model under the same conditions are completely consistent. Considering certain errors between the model and the real object, with the continuous superposition in the vibration process, there will be certain differences between the acceleration signal of the sensor position and the test results.
7 Conclusion
In this paper, the penetration model of three layers of concrete penetrated by two fixed structure missile systems under different initial velocities is established, and a numerical simulation is carried out. The average amplification coefficient and vibration coefficient are analyzed in the time domain under different initial velocity conditions. The results show the following.
(1) When the egg part penetrates through the target plate, the average amplification coefficient of the two kinds of fixed structure sensors decreases with an increasing initial velocity. Under the same working conditions, the body thread fixed structure sensors have a stronger amplification ability to the peak acceleration of the missile body and bear more overload. In the interlayer motion stage, the average vibration coefficient of the two kinds of sensors increases with an increasing initial velocity, and the overall disturbance degree of the elastic priming system of the body screw fastening structure is greater than that of the pressure screw fastening structure under the same working conditions.
(2) According to the data analysis, the performance of the pressure screw fixation structure is better than that of the body screw fixation structure at different initial velocities.
(3) The frequency distribution changes of the missile body and sensor signals are analyzed in the frequency domain. The results show that the initial penetration velocity mainly affects the amplitude corresponding to each frequency of the acceleration signals of the missile body and sensor in the two kinds of fixed missile launching systems but has little influence on the frequency distribution position. With the increase in the initial penetration velocity, the corresponding amplitudes of each frequency of the two missiles and sensors increase.
Data availability statement
The original contributions presented in the study are included in the article/Supplementary material, further inquiries can be directed to the corresponding authors.
Author contributions
PL and JL contributed to conception and design of the study. CL organized the database. HZ performed the statistical analysis. HL and JZ wrote the first draft of the manuscript. All authors contributed to the article and approved the submitted version.
Conflict of interest
The authors declare that the research was conducted in the absence of any commercial or financial relationships that could be construed as a potential conflict of interest.
Publisher’s note
All claims expressed in this article are solely those of the authors and do not necessarily represent those of their affiliated organizations, or those of the publisher, the editors and the reviewers. Any product that may be evaluated in this article, or claim that may be made by its manufacturer, is not guaranteed or endorsed by the publisher.
References
2. Zhang H, Dai K, Yin Q. Ammunition reliability against the harsh environments during the launch of an electromagnetic gun: A review. IEEE Access (2019) 7:45322–39. doi:10.1109/access.2019.2907735
3. Pabio J. Analysis of the deceleration signal of a missile during a hard-target attack. Canada: University of Laval (1997).
4. Lundgren. Signal processing means for detecting and discriminating between structural configurations and geological Gradients encountered by kinetic energy penetrating projectiles. In: Proceedigs of the 52nd NDIA Fuze Conference; May 2008; Sparks, NV (2008).
5. Lundgren. A strain gage based projectile health monitor and salvage indicating circuit for kinetic energy penetrating projectiles. In: Proceedigs of the 53th NDIA Fuze Conference; May 2009; Lake Buena Vista, FL (2009).
6. Craig D, Drew M. Mid scale testing and simulation of fuze terminal ballistic environments. In: Proceedigs of the 51st NDIA Fuze Conference; May 2007; Nashville, TN (2007).
7. Forrestal MJ, Luk VK. Penetration into soil targets. Int J Impact Eng (1992) 12(3):427–44. doi:10.1016/0734-743x(92)90167-r
8. Forrestal MJ. Penetration into dry porous rock. Int J Rock Mech Mining Sci Geomechanics Abstr (1987) 24(3):107. doi:10.1016/0020-7683(86)90057-0
9. Forrestal MJ, Frew DJ, Hickerson JP, Rohwer T. Penetration of concrete targets with deceleration-time measurements. Int J Impact Eng (2003) 28(6):479–97. doi:10.1016/s0734-743x(02)00108-2
10. Boehme B, Roellig M, Wolter KJ. Material characterization of organic packaging materials to increase the accuracy of FEM based stress analysis. In: Proceedigs of the 2nd Electronics System-Integration Technology Conference; September 2008; Greenwich, UK (2008). p. 459–62.
11. Pagliosa C, Neto J. Evaluating the effect of shock absorber layers in the dynamic behavior of PWB with viscoelastic insert. In: Proceedigs of the 11th International Conference on Thermal Mechanical & Multi-Physics Simulation, and Experiments in Microelectronics and Microsystems (EuroSimE); April 2010; Bordeaux, France (2010). p. 1–5.
12. Chakka V, Trabia MB, O Toole B, Sridharala S, Ladkany S, Chowdhury M. Modeling and reduction of shocks on electronic components within a projectile. Int J Impact Eng (2008) 35(11):1326–38. doi:10.1016/j.ijimpeng.2007.07.005
13. Alsakarneh A, Moore L, Barrett J. Evaluation of the use of a rubber buffer layer to protect embedded SIP devices from high mechanical forces. In: Proceedigs of the Electronic Components & Technology Conference; June 2011; Lake Buena Vista, FL, USA (2011). p. 1883–8.
14. Sun W, Chen P. Dynamic contact behaviours involving crystalline diamond nanospheres. Eur J Mech - A/Solids (2020) 80:103896. doi:10.1016/j.euromechsol.2019.103896
15. Sun W, JiangChen JP. Dynamic mechanical contact behaviours of amorphous nanoparticles subjected to high-speed impact. Powder Tech (2020) 363:689–97. doi:10.1016/j.powtec.2020.02.030
16. Sun W, Zhang T, Jiang J, Chen P. Dynamic penetration behaviors of single/multi-layer graphene using nanoprojectile under hypervelocity impact. Sci Rep (2022) 12:7440. doi:10.1038/s41598-022-11497-x
17. Jiang J, chen P, Qiu J, Sun W, Chizhik SA, Makhaniok AA, et al. Dynamic mechanical contact behaviors and sintering mechanism of Al nanoparticles subjected to high-speed impact. Mater Chem Phys (2021) 273:125111. doi:10.1016/j.matchemphys.2021.125111
18. Dewapriya MAN, Miller RE. Energy absorption mechanisms of nanoscopic multilayer structures under ballistic impact loading. Comput Mater Sci (2021) 195:110504. doi:10.1016/j.commatsci.2021.110504
19. Gupta KK, Mukhopadhyay T, Roy L, et al. High-velocity ballistics of twisted bilayer graphene under stochastic disorder. Adv Nano Res Int J (2022) 12(5):529–47. doi:10.12989/anr.2022.12.5.529
20. Lee J-H, Loya PE, Lou J, Thomas EL. Dynamic mechanical behavior of multilayer graphene via supersonic projectile penetration. Science (2014) 346(28):1092–6. doi:10.1126/science.1258544
21. Zhang DM, Gao SQ, Niu SH, et al. Study on collision of threaded connection during impact. Int J Impact Eng (2017) 106:133–45. doi:10.1016/j.ijimpeng.2017.03.012
22. Daouk S, Louf F, Cluzel C, Dorival O, Champaney L, Audebert S. Study of the dynamic behavior of a bolted joint under heavy loadings. J Sound Vibration (2017) 392:307–24. doi:10.1016/j.jsv.2016.12.047
23. Guo Y, Wei Y, Yang Z, Huang C, Wu X, Yin Q. Nonlinearity of interfaces and force transmission of bolted flange joints under impact loading. Int J ImpactEngineering (2017) 109:214–23. doi:10.1016/j.ijimpeng.2017.06.012
24. Fukuoka T, Nomura M, Morimoto Y. Proposition of helical thread modeling with accurate geometry and finite element analysis. J Press Vessel Tech (2008) 130(1):135–40. doi:10.1299/kikaia.72.1639
25. Zhang DM, Gao SQ, Xu X. A new computational method for bolted-joint stiffness. Adv Mech Eng (2016) 8(11):1–9. doi:10.1177/1687814016682653
26. Zhang DM, Gao SQ, Niu S, Liu H. A prediction method for load distribution in threaded connections. J Teoretical Appl Mech (2018) 56(1):157–68. doi:10.15632/jtam-pl.56.1.157
27. Zhang J, Dai K, Wang X, Yu D, Yang B, Zhang H, et al. Improved energy absorption characteristics based on elastic polymer-modified porous material for multiple extreme mechanical impacts. Appl Sci (2020) 10:110. doi:10.3390/app10010110
28. Peng Y, Wu H, Fang Q, Gong ZM, Kong XZ. A note on the deep penetration and perforation of hard projectiles into thick targets. Int J Impact Eng (2015) 85:37–44. doi:10.1016/j.ijimpeng.2015.06.013
29. Mohamad E, Morteza EG, Ghorbani-Tanha Amir K. Generalization of Duhamel's integral to multi-degree-of-freedom systemsProc. R Soc A (2022) 478. doi:10.1098/rspa.2021.0576
31. Chen J, Xu B, Zhang X. A vibration feature extraction method based on time-domain dimensional parameters and Mahalanobis distance. Math Probl Eng (2021) 2021(7):1–12. doi:10.1155/2021/2498178
Keywords: missile-fuze system, penetration, solid structure, time domain characteristics, frequency domain characteristic
Citation: Liu P, Li J, Li C, Li H, Zhang J and Zhang H (2023) Analysis of the influence of different initial velocities on dynamic performance of multi-layer hard target penetration process. Front. Phys. 11:1241762. doi: 10.3389/fphy.2023.1241762
Received: 17 June 2023; Accepted: 29 August 2023;
Published: 14 September 2023.
Edited by:
Marco Lauricella, National Research Council (CNR), ItalyReviewed by:
Weifu Sun, Beijing Institute of Technology, ChinaFuhong Min, Nanjing Normal University, China
Copyright © 2023 Liu, Li, Li, Li, Zhang and Zhang. This is an open-access article distributed under the terms of the Creative Commons Attribution License (CC BY). The use, distribution or reproduction in other forums is permitted, provided the original author(s) and the copyright owner(s) are credited and that the original publication in this journal is cited, in accordance with accepted academic practice. No use, distribution or reproduction is permitted which does not comply with these terms.
*Correspondence: Haojie Li, haojieli@njust.edu.cn; He Zhang, hezhangz@njust.edu.cn